 Leading indicators of customer experience are one of the most misunderstood concepts. And one of the most pivotal for customer experience management (CXM) career success.
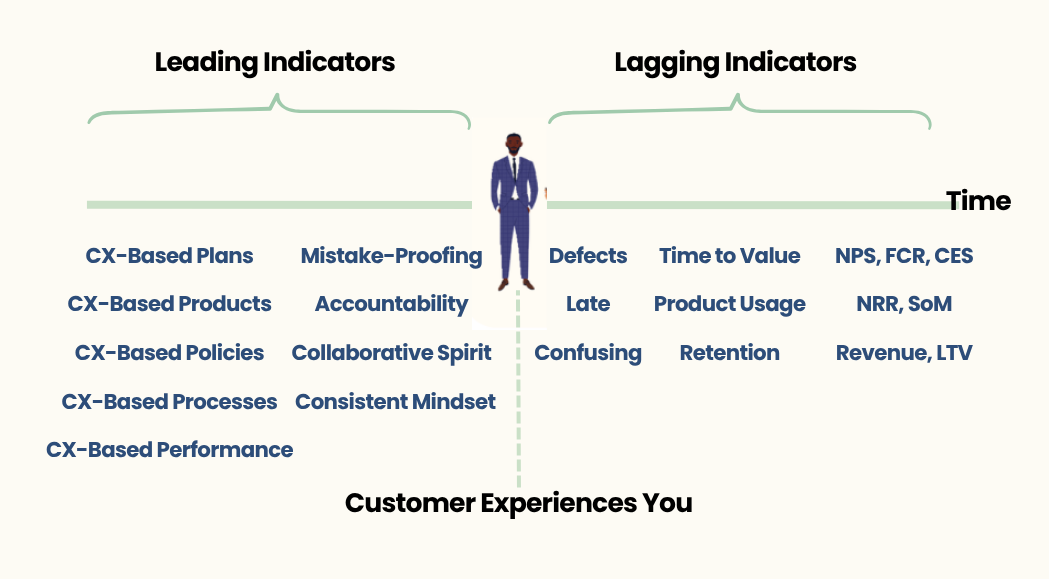
Leading versus lagging refers to cause-and-effect on a timeline.
Lagging indicators can be measured only after a customer experienced you.
Leading indicators can be measured only before a customer experiences you.
This applies equally to all types of customer experience, employee experience, and partner experience. And the leading indicators are affected by what is or is not in-sync among all non-customer-facing roles, as well as customer-facing roles, and alliance partners.
Advantages we achieved when we defined it this way, from the first week I became VoC Manager at Applied Materials (semiconductor equipment maker):
— Mindset shift to ripple-effects on CX.
— Personal responsibility for CX gaps.
— Re-thinking work for customers’ value first.
— Internal customer experience improvement.
— Holistic mindset / systems thinking in decisions.
So far, solutions for 12 bad CX metrics practices were recommended in previous issues of this 8-article series:
Part 5: Business Value
12) Outcomes Over-Focused on Investors
11) Customer Value Missing in Dashboards
10) Expanding Budget via DX for Layoffs
Part 4: Importance
9) Prioritizing with Non-CX Lens
Part 3: Comparisons
8) Benchmarking Diverse Circumstances
7) Benchmarking Biased Data
Part 2: GIGO Data
6) Population Misrepresentation
5) Inconsistent Interpretations
4) Bias
Part 1: Insults
3) Upselling After a CX Fail
2) Automating Interactions
1) Requesting a Score
Part 6 in this series reveals bad CX metrics practices in CX Bonus Pay, CX Root Causes, X-O Data, and VoC Dashboards.
13) Bonus Pay
Bonus pay based solely on leading indicators builds higher ROI in numerous ways. This was our approach when I led company-wide CX alignment at Applied Materials. As a young VoC Manager in our company’s initial year of formal CXM, I said, “Survey scores are a popular basis for CX bonus pay.”
“Never put critiera in bonus pay that a manager/employee cannot control,” is what I was advised. So, we did NOT include survey scores (lagging indicators) in CX-related bonus pay.
Why lagging indicator bonus pay is a bad CX metrics practice:
— Financial pressure on employees backfires as insults to customers.
— Score obsession is self-centric, not customer-centric.
— Data overload (too frequent surveys) is not helpful to managers nor CX nor growth.
— Over-focus on NPS, FCR, CES, etc. asks customers to say what’s already obvious.
— Score benchmarking is a waste due to bias and low statistical confidence and validity.
— Surveys have insufficiently driven higher value to customers and to the business.
Leading indicator bonus pay means people must eradicate root causes of prevalent issues.
Advantages we achieved with leading indicator bonuses:
— Huge hours saved for customers and us.
— Productivity increases for customers and us.
— Revenue increases beyond historical marketing moves.
Win-win! Multi-year high ROI was acheived on each year’s CX-related bonus pay. This means our business value increased far more than the cost of the bonus pay — not only for each year, but with continuing value gains in subsequent years because of that specific year’s achievements.

How to Do This:
1. Give each product team, account team, and functional team their own VoC report.
2. Hold an action-plan workshop with each group.
3. Collect action plan updates quarterly for exec review.
4. Meet with each group’s leader at fiscal year-end:
Extra impressive progress can get 1.5X bonus multiplier.
Great progress can get 1.0X bonus, +/- subjectively.
Unimpressive progress can get 0.5X bonus demerit.
This is what I did for several years: 15-minute year-end video conferences with every leader. Their enthusiasm for maximizing their CX bonus was strong. This is pivotal to higher growth!
How can you use leading indicators for customer-facing employees?
— Use 5 Why’s to go beyond poor CX symptoms to the root causes.
— Mistake-proof the root causes via new process, procedure, and/or policy.
— Customer-facing employee self-monitors their own mistake-proofing in-action.
— Make this a fun contest based on sharing lessons learned, etc.
Other ideas for leading indicators in CX bonuses:
— See 3 CX P&L Methods
14) Root Causes
All popular CX metrics are lagging indicators.
— Measurable after customers’ experience.
— You typically measure CX after a CX fail.
— Customers know it before you do.
— Only a fraction of customers reply to surveys or contact Support.
— Signals from a fraction of customers are a weak predictor of future growth.
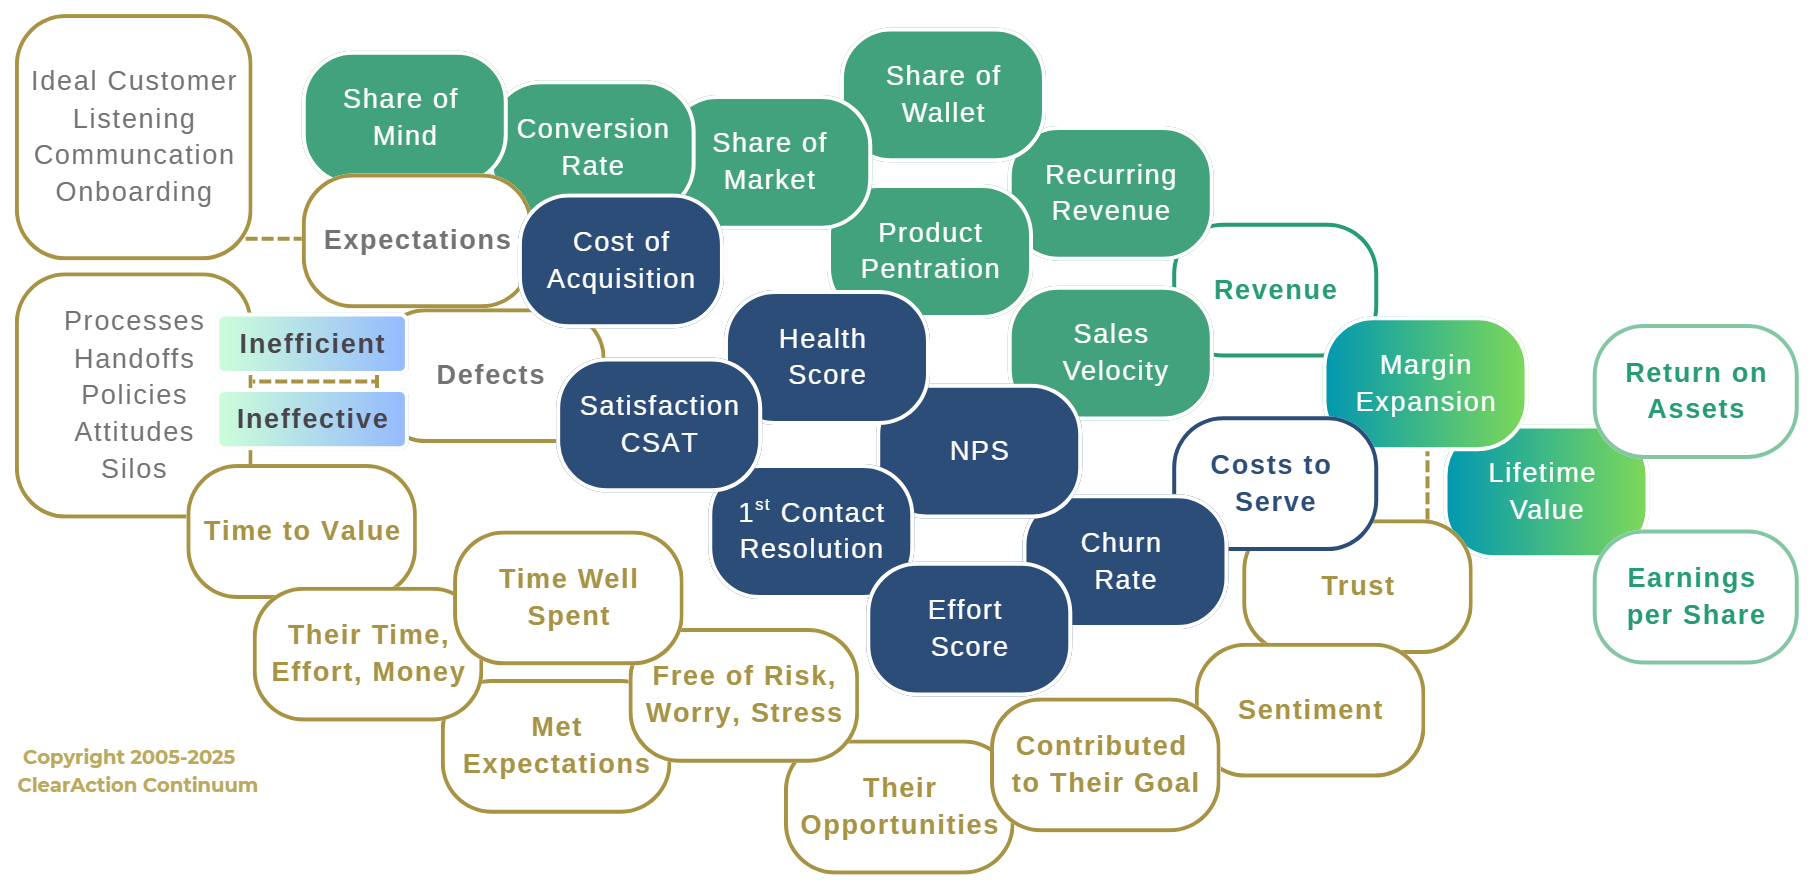
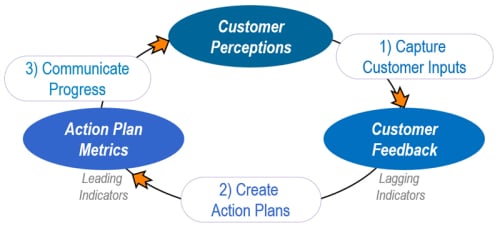
In the diagram above, the point where customers experience you is at the far left:
— Their expectations are set by what you communicated.
— Their realities: inefficient or ineffective, or good.
Based on your processes, handoffs, policies, attitudes, etc.
— All metrics to the right of this point are lagging indicators.
Since leading indicators can be measured only before customers experience you, what’s needed is 5 Why’s analysis2 about what you are doing that causes the symptom.
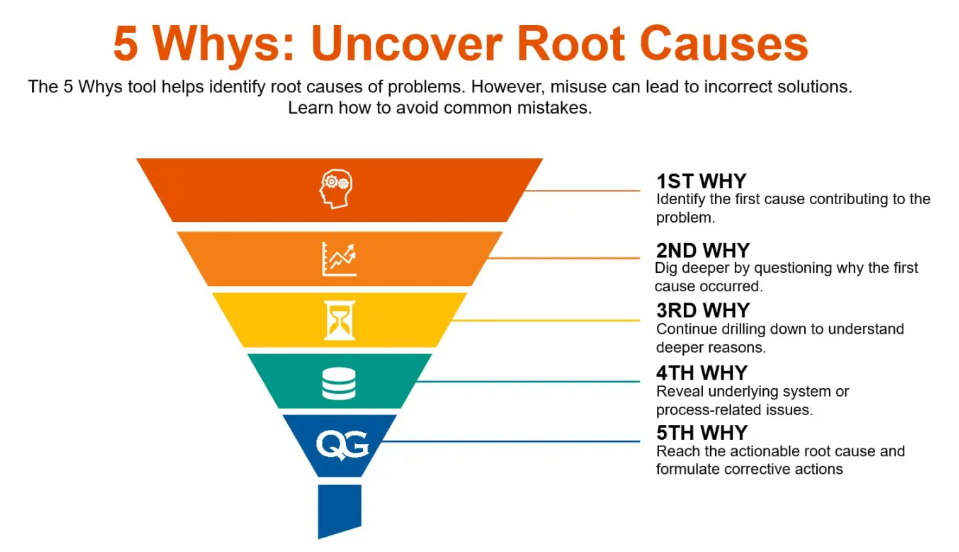
What’s the reason behind the customer perception and behavior?
— What did you do that caused it?
— What drove what you did?
— Why does that driver exist?
— How will you mistake-proof that driver?
How to Do This:
1. Bring 5-8 reps from diverse functions together.
This increases accuracy and speed.
2. They read through customer comments about the issue.
This is the symptom.
They must stand in customers’ shoes.
3. They discuss why this symptom was allowed to happen.
Place sticky notes in the top row on the wall.
4. They discuss why that was allowed, for 2nd row.
5. This repeats through the 5th why (5 rows on wall).
6. They identify an action plan to eradicate the 5th Why.
This is what we did in workshops I conducted throughout Asia, Europe, and North America: all the places where our customers’ semiconductor factories were located. I conducted 50+ business units’ day-long workshops within 3 months. In our second year, this was done by our Core CXM Team of 3. After this, local CX Champions conducted these workshops. The 5th Why was the basis for performance reviews, reports to senior leaders, and CX-related bonus pay.
Start a trend for 5th Why actioning for everything in CXM and beyond. This mindset stops hundreds of root causes from ever happening again. That extra efficiency and effectiveness has a multiplying effect on low operational costs in every department enterprise-wide. Lower operating costs from reduced chaos opens up people’s creativity, productivity, collaborative spirit, and new value generation.
15) X and O Data
The Experience (X) data and Operational (O) data cause-and-effect model is popular.1
— X Data: what customers experienced and reported and did.
— O Data: what’s recorded in your CRM, ERP, HRIS, financials.
Why X-O Data is an insuficient CX metrics practice:
— Connects data that already happened.
— Fails to identify the true leading indicator.
— Typical practices put bandages on dysfunction.
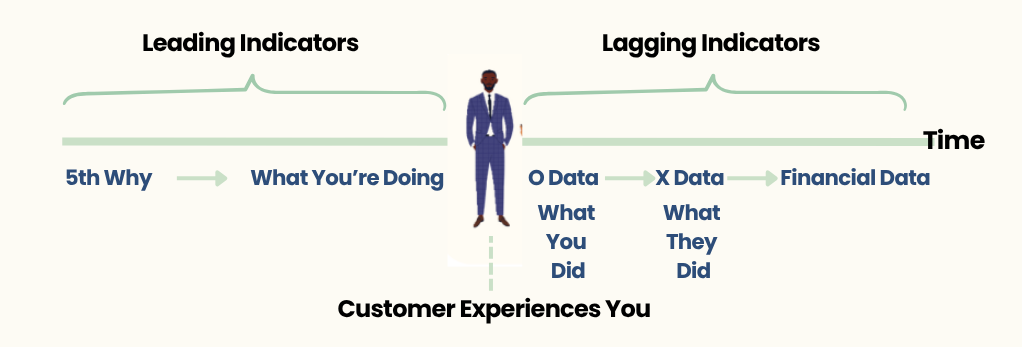
We didn’t need the X-O concept when I was leading company-wide CX alignment. People understood the concept of “before-after customers’ experience” and value of the 5th Why.

This is what company-wide managers understood:
— Customers’ perceptions and behaviors exist.
We can’t accurately understand it without studying.
We study this through surveys and signals.
This is by definition after-the-fact: lagging.
“Customer Satisfaction Measures” track what happened.
— For proactive management, root cause action is needed.
Internal action progress is the CX leading indicator.
“Customer Focus Measures” track eradication of the root cause.
Closed-loop feedback on our action progress is key to a clean slate in perceptions.
CX leading indicators predict near-term perceptions, behaviors, and financials.
Surveys validate or direct fine-tuning of how we manage the business.
Our chairman loved to say this:
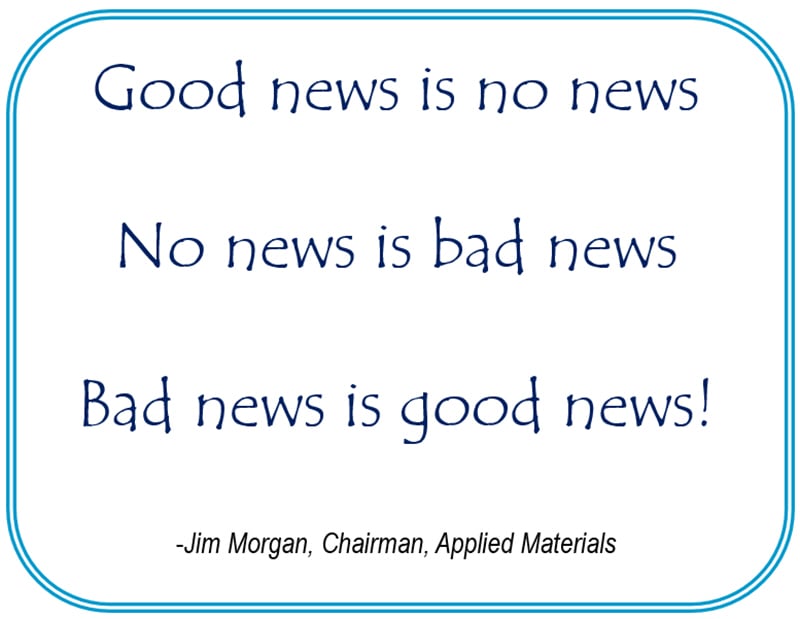
Managers of all types embraced “Bad news is good news” as empowering them to take action on early warning signals for preventing undesirable perceptions, decisions, and behaviors of customers . . . which of course, affects financials for everyone.
This reminder was already on everyone’s salary/wages payment notices before we started formal CXM. Small things like this have a giant positive domino-effect on internal mindsets and preventive, collaborative decisions.
16) VoC Dashboards
All Voice of Customer dashboards are over-focused on lagging indicators.
— Nearly all CXM dashboards have zero true leading indicators.
No amount of real-time VoC makes you proactive.
Your temptation to automate CXM leading indicator dashboards is a bad CX metrics practice.
— As described above, identifying true leading indicators requires a cross-org exercise.
Automated analysis will always be inaccurate.
The 5th Why is rarely identifiable via databases.
Managers’ savvy across diverse perspectives is vital.
Connecting NPS to financials in dashboards is an insufficient CX metrics practice.
— Calculating value of Promoters and Detractors is helpful.
But it doesn’t make you proactive.
It assumes all Promoters are ideal customers.
It assumes no Detractors are ideal customers.
Truth is biz dev’s ideal customer profile may include few Promoters and many Detractors, etc.
VoC dashboards for managers to self-manage issues they cause is a bad CX metrics practice.
— CXM ROI requires bold actions continually.
Data alone implies a safe zone: no action needed. Always false!
Pattern discovery (A occurs 3X more when B follows C, etc.) inspires managers to take action.
— They need your Core CXM Team to hand-hold their action.
Actions on symptoms are bandages on dysfunction.
Cross-org 5 Why’s exercise is prerequisite to root cause identification.
Instead, show how managers’ progress has a domino-effect on customers’ value.
![]()
Focus managers on root cause actions that they can control.
How to Do This:
1. Conduct multivariate analyses to discover patterns.
Combine data sources for richer discoveries.
2. Tailor reports to each group’s lingo and care-abouts.
Get to know your own internal customers.
Focus on 2 biggest actions for them.
3. Conduct actioning workshops urgently.
Tell customers they’ll get a progress report.
Act on the data while it’s fresh.
Don’t allow data overload: focus them on eradication.
4. Set up an accountabilty system.
Consider 1 of 3 CX P&L methods.
Don’t rush for quick wins.
Emphasize eradication: this typically requires many months.
Make CX actioning the basis of your CX-related bonus pay.
Give high visibility to the cause-and-effect from internal decisions to customers’ value to customers’ behaviors to financial outcomes.
Conclusion
Misunderstanding true CX leading indicators handicaps careers and business performance.
When you focus everyone on what they’re doing to prevent issues, everyone is happier.
Rewards make more sense. Chaos subsides. Collaboration increases. Silos shrink.
— Mindsets shift to ripple-effects on CX.
— Personal responsibility for CX gaps thrives.
— Everyone re-thinks work for customers’ value first.
— Enjoy internal customer experience improvement.
— Increase holistic mindset / systems thinking in decisions.
Use the better CX metrics practices as recommended in this article series for customer experience, employee experience, and partner experience.
Plan now to correct your next fiscal year CXM Strategy with all good CX metrics practices.
References:
1 Driving Insights With X- and O-Data, Qualtrics, November 13, 2025.
2 5 Whys Tool: Common Mistakes While Using, QualityGurus.com.
This is the sixth of an 8-part series: 26 Bad CX Metrics Practices to Stop in 2026.
Part 1: Insults repel customers: the opposite of your goals.
1) Requesting a Score: disrespects customers’ truth.
2) Automating Interactions: makes CX hard in unique situations.
3) Upselling After CX Fail: is self-serving, not good CX.
Part 2: GIGO Metrics: misleads managers.
4) Bias: shows your self-centicity.
5) Inconsistent Interpretation: leads to shaming customers.
6) Population Misrepresentation: makes CX data irrelevant.
Part 3) GIGO Benchmarking: misdirects management.
7) External Benchmarks: deceptive, slippery slope.
8) Internal Benchmarks: comparing apples to oranges.
Part 4) Prioritization: sets a faulty trajectory.
9) Prioritization: random approaches yield weak outcomes.
Part 5) Business Value: is no different from customers’ value.
10) Outcomes: boomerang effect for both investors and customers.
11) Customer Value: metrics about you don’t prove value to them.
12) Budget Expansion: DX and layoffs don’t expand growth budgets.
Part 6: Leading Indicators: to-date are a mirage.
13) Bonuses: based on scores hurts CX, EX, and growth.
14) Root Causes: to-date are symptoms with deeper roots.
15) X & O: puts bandages on dysfunction.
16) VoC Dashboards: have no leading indicators.
Coming Soon
- Part 7) Goal Silos
- Part 8) Metric Silos
Image licensed to ClearAction Continuum by Shutterstock.