
If “trust” has felt too vague to act on, this framework breaks it into consistency, response, connection, value, and friction—so you can turn CX insight into concrete moves that increase retention instead of just explaining churn after it happens.
We have fallen in love with optimizing our CX metrics instead of earning them.
The global CX management market is on track to reach $26 billion in 2026. Investment in tools, platforms, AI-powered services, and experience design has never been higher. And yet, according to Zendesk’s 2026 CX Trends report, 83% of consumers still believe their experiences should be better than they are today. Spending is accelerating, but trust is not.
This isn’t a technology or process problem. It is a measurement problem that has become a strategy problem. At the center of this is a metric many in the industry have treated as a proxy for something it was never designed to measure.
NPS (Net Promoter Score) solved a real problem when Fred Reichheld introduced it in 2003. It gave practitioners a single, comparable metric that correlated with growth and was simple enough to actually get used. For organizations drowning in survey fatigue and conflicting data, that simplicity made it actionable.
The NPS question — How likely are you to recommend us? — is valuable, because willingness to recommend reflects a customer’s relationship with a brand and can be a useful diagnostic in the right context. But NPS captures that willingness at a single point in time; it measures momentary sentiment and satisfaction, not structural trust. A customer can give you a nine and still leave the moment a competitor offers a better deal, because loyalty built on satisfaction alone is transactional and holds only until something better appears — and that is not the same thing as trust.
Trust is different. When a customer trusts you, they may stay even when something better appears. Because they believe you will be there when things go wrong, that your consistency is not circumstantial, and that the relationship is real.
The Customers You Are Losing Are Not Filling Out Your Surveys
A company I consulted with had a problem they could not explain. Churn was climbing, their NPS data showed no reason for concern, and customers were leaving with no data that explained why. When I audited their measurement approach, the issue became clear almost immediately. They had not just measured NPS; they had optimized for it.
Surveys were triggered at the moments customers were most likely to be satisfied: right after a successful onboarding call, immediately following a resolved support ticket, and in the wake of a product win. The methodology had been tuned to capture customers at their happiest, resulting in scores that revealed nothing about the customers about to leave.
They had no system to detect customers who had stopped engaging — no way to flag disengagement, route negative social conversations, or escalate at-risk accounts. Social and support teams were not talking to each other. Without an escalation protocol or social listening in place, there was no mechanism to catch what the surveys were missing. The result was a system built to optimize the metric rather than the customer experience.
When I added social listening to the audit, the picture changed entirely. Customers who were not responding to NPS surveys were expressing their frustrations, but not to the company. They had moved their honesty to places where they believed it would actually be heard: public forums, community conversations, and peer networks. The NPS dashboards showed a 4.3 out of 5, but the social listening data told a very different story.
This pattern is not unique. Research from SuperOffice found that only 1 in 26 customers will complain about a bad experience, while the other 25 churn without a word. CSAT and CES share the same structural gap as NPS: they capture momentary sentiment during specific interactions, but not the slow erosion of trust that precedes churn. That erosion rarely shows up in surveys; it surfaces in withdrawal — stopped logins, ignored emails, and conversations happening on social or in closed communities.
That 4.3 NPS score does not indicate how many at-risk customers chose not to respond. Those customers will churn without warning. You do not have a complete picture; you have a curated one.
We Are in a Trust Recession
The 2026 Edelman Trust Barometer, surveying nearly 34,000 people across 28 countries, found that trust is no longer retreating from institutions alone. It is retreating from society itself.
- Government sits at 53% trust globally.
- Only 32% of people believe the next generation will be better off.
- Seven in ten report reluctance to trust someone whose values differ from their own.
In other words, people are pulling back from trusting large institutions and placing more of their trust in smaller, familiar circles of family, friends, and close communities.
A brand that gets this right — operating with genuine consistency, responding in ways that show it cares, reducing the friction it asks customers to absorb, and making people feel the relationship has weight beyond the last transaction — is not just winning a CX competition. At a time when nearly seven in ten people are pulling their trust into smaller circles, a brand that functions as a stable, reliable presence is offering something structurally scarce.
Trust Is Not the Output of Good Experience, But the Infrastructure Beneath It
Most CX programs operate on a reasonable premise: deliver good experiences consistently, and customers will stay. The flaw is not the commitment to a good experience. It is the assumption that experience delivery and trust operate on the same layer. They do not. Trust is built through organizational design decisions — whether your behavior is coherent across channels and teams, whether you show up when something breaks down, and whether the relationship has weight beyond the last transaction.
Mayer, Davis, and Schoorman showed that people judge trustworthiness on three dimensions: ability, benevolence, and integrity (Mayer, Davis, & Schoorman, 1995). Benevolence is the sense that a brand genuinely wants to do right by its customers, and integrity is the sense that it actually lives up to the principles and promises it claims to stand for. Those beliefs are not created by one smooth interaction; they build over time and across situations, especially when something goes wrong. For brands that fear a bad experience, that is often where real trust is born: it is easy for customers to love you when everything is smooth, but loyalty is tested when it is not.
The Customer Trust Equation as Diagnostic
I developed a diagnostic framework for the gap between momentary satisfaction scores and the structural trust that keeps customers when something better appears.
Trust = Consistency + Response + Connection + Value − Friction
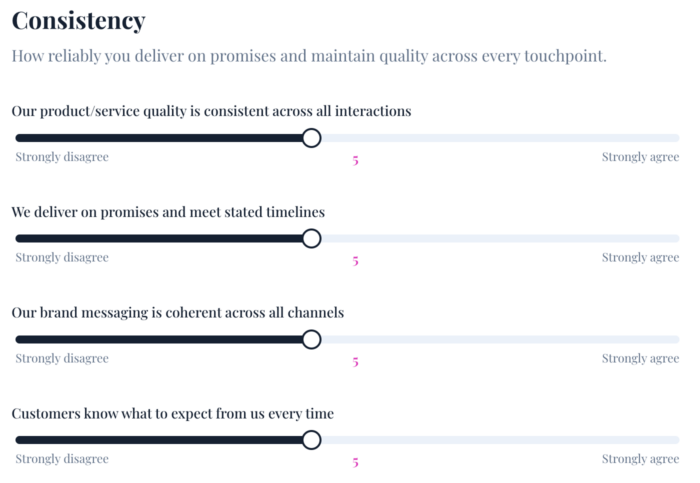
Consistency is the variable most organizations underestimate. It is not about doing things well once, but about doing things consistently across channels, interactions, and teams. When consistency erodes, trust erodes before customers can name it; individual interaction scores may look fine, but the overall pattern breaks down.
To understand where you stand on consistency, look across the whole organization: the quality of your product or service, how reliably you keep promises and deadlines, how aligned your brand messaging is across channels, and whether customers know what to expect from you.
The core question underneath all of this is simple: do you signal that people can count on you? Are you dependable and reliable?
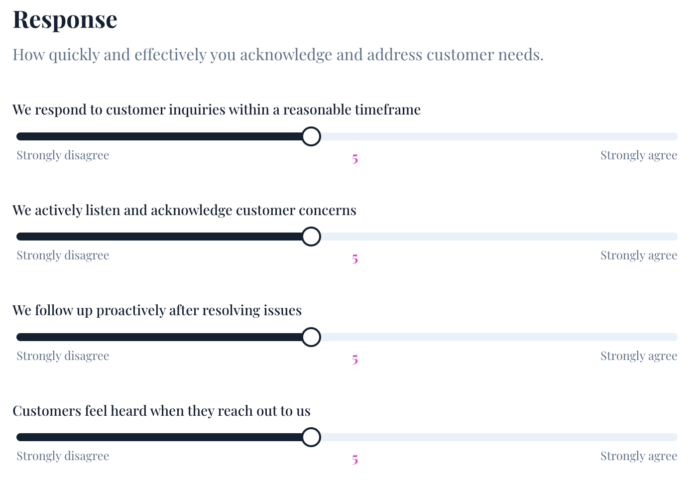
Response is about whether you show up when it matters. It is not just the speed of reply, but the quality of presence. A customer who reaches out in frustration and gets a scripted deflection learns something very different about you than a customer who receives an accountable, human response; that distinction does not live in handle-time metrics, but in whether the customer felt someone actually cared what happened.
It is easy to treat response as “how support answers tickets,” but it is broader than that. Speed matters only when it matches customer expectations. A fast reply that is unhelpful or vague about next steps is speed disguised as help — and often makes the brand feel cold and unfeeling.
A common trap with automated responses is failing to follow through beyond a survey link. Closing the response and feedback loop is crucial: you need to confirm that the issue is actually resolved, not just that the ticket is closed.
Connection determines whether customers feel seen as people rather than accounts. It creates the kind of loyalty that holds even when a competitor makes a better offer; satisfaction alone does not build that loyalty, but a sense of belonging does.
Many brands work hard to build connection — through communities, creator partnerships, or personalized campaigns — but often end up performing connection instead of creating a genuine feeling of belonging. The question you have to be able to answer is simple: how do you make customers feel special and more than a ticket or a row in a spreadsheet? How are you personalizing their experience in ways that show you genuinely care about them and their needs?

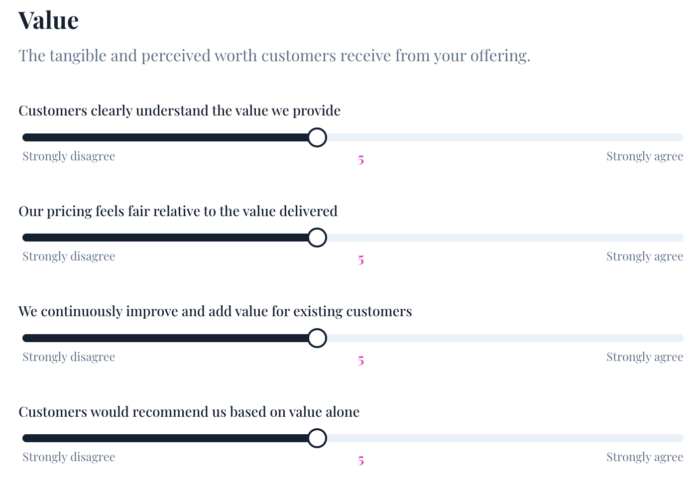
Value goes beyond price and product. It is the customer’s sense of what the relationship gives them, including the intangibles of feeling well-served, respected, and understood. When value erodes, customers start doing the mental math on whether the relationship is still worth it.
You can be the priciest option and still feel like a bargain, or the cheapest and still feel like a waste. Value is not what the offering costs, but what it means to the customer: a low-cost tool that eliminates a hated task can feel priceless, while an expensive platform that never quite works for the team feels like a drag on the business.
Product adoption, customer education, and genuinely helpful support help customers reach value faster — regardless of price. Once customers know how to get the most from your offering, they can advocate for it and refer others. When you hear customers articulating the value they get, treat that as a signal to elevate those stories into testimonials, case studies, and broader marketing.
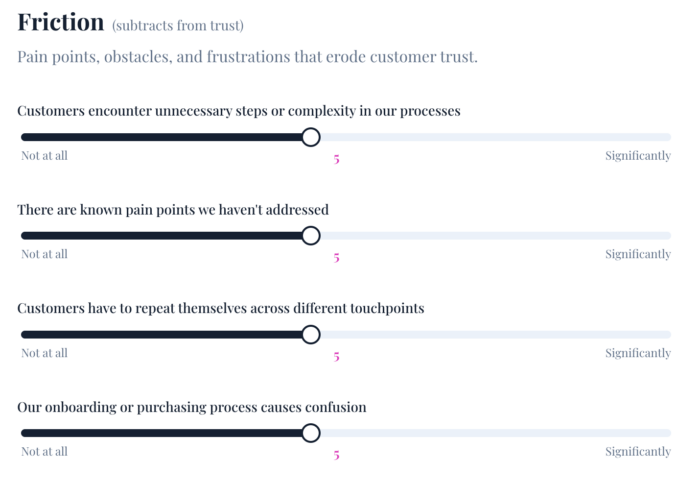
Friction is the variable that gets subtracted. It is not just slow load times or complicated return policies, but also the cognitive labor of figuring out where to get help, the emotional labor of escalating a problem repeatedly, and the feeling of having to prove an issue is real before anyone takes it seriously. High-friction experiences signal that a customer’s time is not valued and their problems are not a priority, so over time they stop telling you about them because they give up on you fixing them.
To find your friction points, look closely at how you actually work with customers. Are you easy to work with, or are you optimizing for internal workflows that quietly add headaches and extra steps for customers? In practice, how easy do you make it to love you and trust you?
The Equation in Practice
Breaking trust into these variables forces you to examine the whole organization. You can’t game the equation: you are either consistent, responsive, connected, delivering value, and reducing friction—or you are not.
In practice, the equation and diagnostic have helped clients do three things:
- Improve response quality and reduce repeat contacts.
One client discovered their response automation optimized for speed but not quality. After redesigning replies to set clear expectations and actually solve issues, repeat tickets on the same problems dropped and CSAT on support interactions rose. - Expose hidden friction in handoffs and journeys.
Another client used the friction scores to audit handoffs between teams. They found customers weren’t churning out of anger, but because processes were confusing and loops of automation made getting help too hard. Simplifying those handoffs improved retention and prevented the usual drop in NPS and CSAT later in the journey. - Shift “connection” from performance to genuine belonging.
A third client used the connection lens to review personalization and community efforts. They paused automations that only made internal work easier and reworked them to feel more human and relevant. As they did, social complaints about support and bots decreased, while drip campaigns saw higher open and click‑through rates.
Looking at each variable this way gives leaders early warning signals. Instead of reacting to churn after the fact, they can see where their company’s behavior is likely to disappoint customers and adjust the system before trust erodes. Across clients, using the equation this way has reduced repeat contacts, surfaced hidden churn risk earlier, and strengthened outcomes like retention, CSAT, NPS, and campaign performance.
The Path Forward
Start with an honest audit of what your measurement system can and cannot see. If your survey triggers have been optimized for score outcomes rather than honest signals, you are measuring your best moments, not your real ones, so fix the timing before you trust the data.
Build social listening into your retention infrastructure; the customers most at risk of leaving have already moved their frustration outside your owned channels, and if no one is routing those conversations back into the organization, you do not have a data gap, you have a design gap.
Then examine your cross-functional patterns. Consistency, response quality, connection, value, and friction do not live in individual touchpoint scores but in what happens across teams, channels, and time; if your support protocols differ from your success protocols, or if marketing makes promises onboarding does not keep, the aggregate pattern is communicating something your dashboard is not.
The CX industry will keep growing, and the tools will keep improving. None of that closes the trust gap if organizations continue treating trust as the output of good experience rather than the infrastructure beneath it. The path out is not a better survey. It is the organizational decision to measure whether the conditions for trust actually exist — and then build them.
The NPS autopsy line is the whole article in one sentence. You’re measuring the corpse and calling it a retention strategy.
The piece that most businesses miss, and you named it clearly, is that the customers most at risk have already moved their frustration somewhere you can’t see. They are out talking to a competitor and not filling out your silly survey, .
The trust equation gives practitioners something they can actually act on instead of just explaining churn after it happens. That’s the gap most CX frameworks never close.
Well done.
NPS and metrics in general was a double edged sword. On one hand it brought attention to the importance of CX and business outcomes. That being said, i think great companies and their leadership already understood that. The other side of the sword we still live with today: chasing numbers vs. fixing problems. I have been measuring stuff for a living for 30 years, but the act of measurement does nothing to CX. Taking action does. If we took 5% of the effort in measurement and applied to change, we would actually see the customer experience improve…which it hasn’t across industry for 30 years. FWIW. Thanks for the share.