How much traffic do your competitors earn? And from which keywords? Plenty of tools claim to know, but no tool can give you 100% accurate results.
Many companies rely on one of two popular tools, SimilarWeb and SEMrush, which use different kinds of aggregated data to estimate sites’ traffic volumes. We aimed to measure the accuracy of their estimates against known traffic from Google Analytics for 787 websites.
The results of this research reveal how accurate these tools are in general, how they overestimate and underestimate traffic volumes, and how their accuracy varies based on website size, industry, etc.
How traffic analyzers like SimilarWeb and SEMrush work
Data sources for traffic analysis typically include several of the following sources:
– Data from website owners who have previously used the given traffic analyzer;
– Third-party data from internet providers and other partners;
– Crawled public data;
– Clickstream data (anonymized data on traffic samples);
– Undisclosed panel data collected by browser extensions.
The business sphere and domain — Each traffic analyzer gathers data from the regions and markets where their clients are from. Therefore, they can offer more accurate information to other businesses from those same regions and markets.
This collected data isn’t used in its raw state, however. SEMrush and SimilarWeb have to decode each clickstream data sample with the help of AI/ML algorithms to approximate the size of a website.
Smaller websites have little chance of being accurately approximated from clickstream data. That’s why the results you get from traffic analysis tools are usually directional but rarely spot on.
Even if two tools use the same data sources, their algorithms differ. If the volume of traffic for an analyzed website is low, algorithms have little or nothing to approximate and typically make even more mistakes. (Thus why traffic analyzers may show “no data available.”)
What should you do if traffic to your nearest competitors’ websites is low and can’t be benchmarked? Try to find someone bigger in your niche to review their stats. You can do this by browsing providers of a similar service or product in a larger region, or, if you’re looking for competitors to a local business, look for those similar to yours but in a more populous location.
Benchmarking your traffic against a business that’s much bigger than yours can provide a helicopter view of your industry — and help ground planning in realistic expectations.
How we compared SEMrush and SimilarWeb
We created an anonymized benchmark sample of traffic data for January 2020 from the Google Analytics accounts of 787 websites. As we had access to the precise Google Analytics data on visitors to these websites (since they’re OWOX BI users), they chose this data as a baseline for benchmarking.
The websites were based in the United States, Australia, United Kingdom, Canada, and Germany, and represented 10 industries:
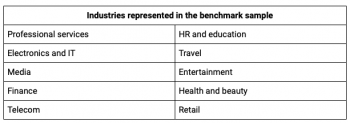
We also segmented the chosen websites by traffic volume:
– Small: Less than 500,000 sessions per month.
– Medium: 500,000 to 1,000,000 sessions per month.
– Large: More than 1,000,000 sessions per month.
All 787 websites were analyzed with both SimilarWeb and SEMRush, and the results were saved in a simple table and compared against the true values from Google Analytics.
Results
Standard deviation
Traditionally, standard deviation measures how values deviate from the mean (the average of all values). We measured deviation from canonical values taken from Google Analytics accounts. The results of this deviation are negative if a value is smaller than the canonical value or positive if it’s larger. If the actual value is equal to the canonical value, the standard deviation is zero.
The standard deviation shows how SEMrush and SimilarWeb estimates of traffic volumes differ from the canonical values in Google Analytics. The results are provided as absolute values to avoid positive and negative values offsetting one another and to concentrate on accuracy (rather than over- or underestimates).
In the graph below, you can see the percentage of websites in each traffic group that had a high standard deviation, and thus whose traffic volumes were estimated incorrectly by SimilarWeb and SEMrush.
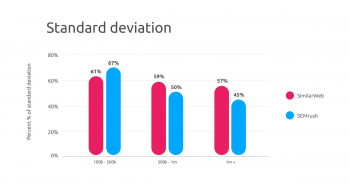
SimilarWeb showed a standard deviation of 57% to 61% for all traffic groups. SEMrush showed greater accuracy than SimilarWeb (45% compared to 57% for websites with over 1 million sessions), but had less-accurate estimates (67%) in the small websites segment.
Thus, SimilarWeb appears to provide more accurate estimates for most websites, though SEMrush works better for high-traffic websites.
Share of observations
The share of observations is the percentage of websites within each segment for which the given service was closer to the canonical value than its competitor.
The graph below shows the percentage of websites in each traffic volume category that were predicted with a higher accuracy by SimilarWeb vs. SEMrush.
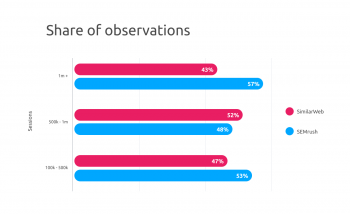
SEMrush demonstrated greater than 50% accuracy for the large website and small website segments (the top and bottom sections of the graph). SimilarWeb was slightly more accurate for the medium websites segment (the middle section of the graph).
However, as the standard deviation chart suggests, when SEMrush estimates for small websites were wrong, they were likely off by a greater amount compared to SimilarWeb.
Share of positive and negative deviations
The red and blue dots in the graph below represent positive and negative deviations for SimilarWeb and SEMrush respectively. This graph shows you if traffic analyzers are more likely to underestimate or overestimate traffic values.
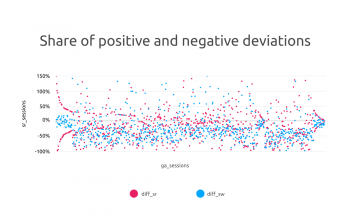
The conclusion is obvious—SimilarWeb underestimates true traffic values.
Accuracy by business sphere
The 787 websites OWOX considered in their research can be divided into 10 industry segments. Here’s how many websites were in each segment:
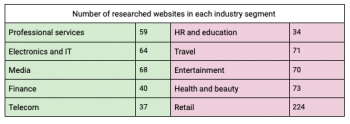
The next graph shows the accuracy of SimilarWeb and SEMrush approximations by business sphere:
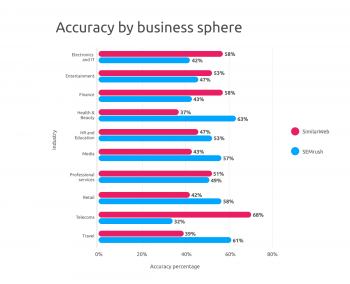
Here’s what this graph helps us understand:
– SEMrush showed more accurate traffic estimates in the spheres of Health & Beauty (63%), Media (57%), HR and Education (53%), Retail (58%), and Travel (61%).
– SimilarWeb showed more accurate estimates for Electronics and IT (58%), Entertainment (53%), Finance (58%), and Telecoms (68%).
What to do with these numbers is up to you, but the important thing is to conduct your competitor analysis with the same tool each time to make your research consistent.
After you change the tool, you should take time to gather data and find out how the results differ from the outputs of your previous tool.
Conclusion
If your business is mature enough to move from self-benchmarking to setting goals based on data about your nearest competitors and market leaders, the accuracy of third-party tools starts to matter more.
If deciding between SimilarWeb and SEMrush for your business:
– SEMrush showed better accuracy and a smaller deviation from Google Analytics data for websites with more than 1,000,000 sessions per month.
– SimilarWeb works better for low-traffic websites.
– SEMrush works better for websites in the health and beauty; travel; and retail domains.
– SimilarWeb is more accurate than SEMrush for most businesses in the telecom, finance, and computer industries.
– SimilarWeb is more likely to underestimate traffic volumes.