Brands Struggle to Engage Consumers as Brand Leadership Shifts in 58% of Categories
Apple, Amazon, Netflix, Facebook, Google Dominate
NEW YORK, NY JANUARY 18, 2017
– Soaring customer expectations are creating an increasingly challenging
environment for online brands searching for engagement, according to Brand Keys 15 22nd annual 2017
Customer Loyalty Engagement Index® (CLEI), conducted by the New York-based
brand engagement and customer loyalty research consultancy ( brandkeys.com).
Brand Engagement = Category Leadership
“’Brand engagement’ is how well a brand is able to meet expectations
consumers hold for the path-to-purchase drivers in a category,” said Robert
Passikoff, president of Brand Keys. “Those drivers and expectations come in
the form of a Category Ideal. Brands best able to meet consumers’
expectations for that Ideal generate greater loyalty and are profitable
market leaders. Brands that can’t meet expectations lose customers and
market share.
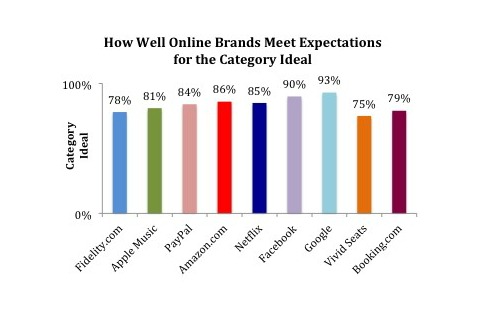
Online Brands That Engage Best
This year the CLEI examined 83 categories and 740 brands, where brand
engagement leadership shifted dramatically in 49 of those categories. In
the Online category expectations have increased 35% over 2016. Online
sector brands have only kept up with that by 8%, leaving an enormous gap
between what consumers want and what brands are seen to deliver.
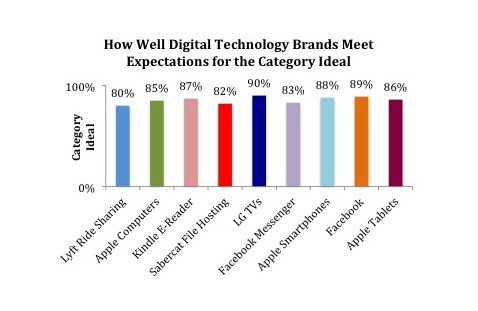
The ratings of online brands that follow represent the highest levels of brand engagement generated for the categories in which
they compete and were compared to consumer-generated, category-specific
Ideals, computed to be 100%, which permits category-to-category comparisons
to be made.
Why Consumers Expect More
“The concept of brand engagement is pretty straightforward,” said
Passikoff. “Consumers have an Ideal for every product and service; it’s the
yardstick they use to measure brands. Defining your category’s Ideal is
where it gets very tricky. The process is more emotionally-based than
rational, so defining the Ideal and identifying what consumers expect from
their Ideal has to be more penetrating and subtle than a 10-point scale,”
noted Passikoff.
“It needs below-the-radar, psychological metrics,” said Passikoff, “Because
today’s consumer does not behave as he says, he does not say what he really
thinks, and he does not think what he really feels.
Consumers talk to themselves before they talk to brands, hot-wired to
social networking, which super-charges expectations. The result? Massive
gaps between what people really want and what brands deliver,” noted
Passikoff. “And confusion among marketers about what actually drives
engagement.”
The Ideal describes the precise path-to-purchase drivers, describing how
the consumer will view the category, compare brands and
how they will engage with the brand, buy, and remain loyal. “Most
marketers look at the world through a brand-lens,” noted Passikoff. “It’s
their brand, after all.
The consumer, on the other hand, looks through a category-lens and
that dichotomy can create problems when marketers try to engage consumers
with their brands.” Drivers are category-specific since consumers don’t buy Smartphones in the same way they buy Cosmetics or Pizza.
The four path-to-purchase drivers for the Smartphone category, for example,
look like this:
1) Brand Design,
2) Platform For All My Needs, 3) Personal Connectivity,
and 4) Brand Support.
The Pizza category, on the other hand, looks like this:
1)
Made-to-Order Taste, 2) Customizable Extras, 3) Brand Image/Value,
& 4) Connected Delivery
Values That Fueled Expectation Growth in the Online Category
Path-to-purchase drivers are made up of sets of emotional and rational
values that come together to define the category for the consumer. The ones
that are more leveragable are where expectations increase the most. The
value that fueled expectations most in the Online Categories was related to
one form of Personal Connectivity or another. Increases ranged
from a +28% (for Ticketing Services) to 36% for Online Brokerages.
“Brands that can best fill that expectation gap win,” said Passikoff,
“Brands that can’t meet expectations have little to recommend them. That
paradigm resulted in a leadership shift in 58% of the categories we tracked
this year. And, as these are predictive of consumer behavior, will show up
in market share and profits in the new year.”
A complete listing of this year’s 83 categories can be found at:
Methodology
For the 2017 survey, 49,168 consumers, 16 to 65 years of age from the nine
US Census Regions, self-selected the categories in which they are consumers, and the brands for which they are customers.
Seventy (70%) percent were interviewed by phone, twenty-five (25%) percent
via face-to-face interviews (to identify and include cell phone-only
households), and 5% online.
Brand Keys uses an independently validated research approach that fuses
emotional and rational aspects of the categories, identifies the four
behavioral drivers for the category-specific ‘Ideal,’ and identifies the
values that form the components of each driver. This year Brand Keys added
11 new categories including Energy Drinks, Snack Brands, Toys, and Yoghurt
resulting in engagement evaluations of 740 brands.
The assessments measure how well brands meet expectations that consumers
hold for each path-to-purchase driver that makes up the Ideal for a
specific category. The research technique is a combination of psychological
inquiry and statistical analyses, has a test/re-test reliability of 0.93,
and results generalizable at the 95% confidence level. It has been
successfully used in B2B and B2C categories in 35 countries.