
The annual relationship survey is dreaded in many companies by both executives and customers. In moments of candor, descriptions of “waste of time, puts me to sleep, nothing new, and fails to move the needle” are used.
However, some companies are continually improving and innovating based on such surveys. What is the difference? Customer Care Measurement & Consulting has observed four broad areas that differentiate companies making good use of surveys and Voice of the Customer (VOC) process from companies that often spend more dollars while accomplishing very little.
Successful Surveys Require An Intelligent Context
First, understand the purpose of the survey using a chart like the one below. There are five types of surveys:
- Transaction surveys that measure the outcome of a particular interaction
- Relationship surveys that gain feedback about most or all of the customer journey including key points of pain (POP) and their impact on loyalty and satisfaction
- Competitive surveys that ask current customers about their experience with both the company and its competitors
- Market research surveys that address a person’s willingness to purchase a current or hypothetical product
- Pulse/Public Affairs issue surveys that address emerging political or social events
For a systematic customer feedback process, only three of the above surveys are relevant: transaction, relationship, and competitive surveys. The problem with survey results from how the surveys are used and the context or lack of context. Surveys can be used for creating a baseline from which improvement goals are established or for tracking progress toward a previously set goal. Figure 1 illustrates these two broad purposes and how the five types of surveys can be directed.
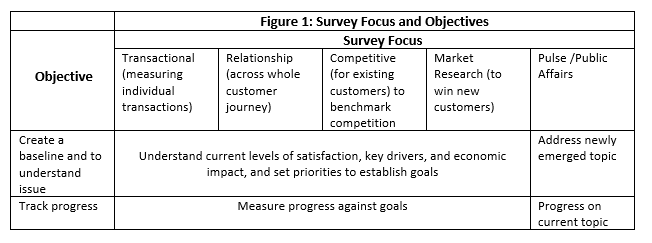
Baseline and tracking surveys can be directed toward a particular transaction, the overall customer experience (CX), or the competitive marketplace. However, the focus for all three of these surveys is the existing customer. Market research surveys primarily explore how to win new customers or, sell new products to existing customers.
Second, design and execute the survey in partnership with the Quality, Insights, Finance, and CX functions to ensure that action will be taken on the results. Quality and CX can do root cause analysis and pilot test solutions. Insights provide the skills to ensure a professional survey design. Finance’s participation will guarantee acceptance of the resulting business case.
Third, the survey should be designed to produce a credible business case for specific actions. Focus on parameters that can be easily converted into financial impact including impacts on loyalty (convertible to increased revenue), word-of-mouth (WOM) (convertible to new customer acquisition), reduced sensitivity to price (enhanced margins) and unnecessary contacts (increased cost). Use a conservative value of the customer, ideally one half of the lifetime value of the customer as defined by Finance.
Fourth, gain agreement from executives that accountability for response to the issues identified by the survey are assigned. Define in advance how the top granular issues identified by the survey will be prioritized and assigned to an owner. Recognize in advance that almost all issues are cross-functional and that one executive will need to take the lead on each issue, gaining cooperation from other functional managers along the way. [1]
Fifth, stay the course for at least six years. Changing key performance metrics (KPI) every year destroys accountability of action. Once you agree on a set of KPIs, don’t change them. Modifying metrics resets the game and lets everyone off the hook.
Sixteen Tactical Best Practices for Survey Execution
Survey Design
- Prepare management for bad news from the survey. However, explain how the weaknesses described by the bad news can be translated into enhanced revenue opportunities.[2] I start my briefings with the statement, “if you do not have a headache at the end of this briefing, I’ve not done my job because you are not paying me to make you feel good, you’re paying me to tell you how to make more money.”
- In the survey invitation to customers, highlight what has been done with feedback in the past and promise feedback on the current project in 90 days. One fast food chain stated, “based on your input, we brought back BBQ sauce.” Response rates increased significantly.
- Use a channel for the administration of the survey that is convenient and not onerous to customers. Telephone surveys and post-contact interactive voice response (IVR) surveys require a response at the company’s convenience. Email surveys allow the customer to respond when it is convenient for them.
- Assure that the sample and the actual profile of respondents are credible. A minimum of 360 survey responses is needed to provide a statistically reliable sample and 1,000 responses are even better, providing a 95 percent confidence level. Also, compare demographics such as gender, dollars spent on products, and age to show that the sample matches the overall customer market.
- Measure granular issues across the entire lifecycle – don’t ignore marketing and sales. Dissatisfaction with billing or product performance are too general to act upon. Aid the customer with a list of the 10 to 40 specific issues you hear about in service across the entire customer journey. Such a list will triple the number of issues and problems reported. Build this list from service contacts.
- At the end of the email survey, ask if respondents will entertain an in-person call to probe a few issues. We find that a majority of respondents will agree to receive such a follow-up call and will provide either an email address or phone number. This allows for understanding the dynamics of issues and provides compelling quotes for the report.
Analysis
- Use regression analysis to derive key drivers of loyalty and satisfaction. Also, identify the key POP based on both frequency and damage to loyalty.
- Create an economic imperative for action in terms of lost revenue, WOM, sensitivity to price, employee frustration, and employee time wasted. Show the revenue and WOM damage by issue per month. Revenue damage over a year allows management to study the issue for months, while damage per month conveys, “we need to do something now!”
- Provide granular actionable recommendations. If you have Quality and CX assisting in the survey analysis, you can identify the three most appropriate strategies: prevention of the issue, surfacing the issues that are occurring so they can be fixed, or successfully handling the issues that are reported so that most customers remain loyal.
- Bolster survey findings using other types of data including contacts, operational data, and employee confirmations. If the survey flags a problem with production, logistics, or billing, the internal data will describe the existence and prevalence of each of these types of problems, e.g., transaction failures or late deliveries. Use this operational data to show that the customer survey is valid and is probably understating the prevalence of the problems. Usually, less than a third of customers encountering a problem complain to the company.[3]
Output
- Present data in a positive glass is half full tone, critiquing processes rather than individual units or managers. Follow this analysis by, “here is how much revenue we are leaving on the table for each month of inaction.” To quantify the cost of inaction precipitates action.
- Provide a business case for overall realistic CX improvement as well as specific recommendations. The overall improvement target should be the sum of the lift in satisfaction or loyalty achieved by the individual recommended actions. This avoids the prevalent approach to target setting of an arbitrary number because a score of 88 sounds much better than the current 82 percent satisfied, or a 30 Net Promoter Score is better than an NPS of five. If it looks arbitrary, the target will have no credibility.
- Integrate customer POP with data on known employee POP. You will normally see at least a 50 percent overlap between the two since employees are frustrated handling customer problems that are preventable via better processes.
- Tailor the report to each audience, stressing the top three or four findings and recommendations that are relevant to each audience. The audience will tune out unless at least one of the top recommendations applies to an issue they are concerned about.
- Promise Finance that you will validate the survey results over time by comparing what customers say they will do to what they actually do. This may take six or eighteen months, but the fact that you are doing it will go a long way in winning the CFO’s support.
- Communicate to customers and employees on the results and the top three-six actions you intend to take.
Summary
Badly conceived and executed surveys alienate employees who don’t believe the data and alienate customers who feel you don’t respect them and are wasting their time. On the other hand, when a survey is well-conceived and appears actionable, you get surprisingly positive feedback from customers.
I saw one survey response from a Harley Davidson customer who noted: “Finally someone sent me a no BS survey, it looks like you really want to solve problems!” The CEO of a financial service company received 54 emails saying, “I’m so happy you sent me this survey, you have real guts asking about problems and it gives me confidence that you will take action on the results. I intend to remain a loyal customer. Well done!”
Following the above best practices will earn your survey this type of praise and impact.
Notes:
[1] See assignment of issues in John Rossman, The Amazon Way, 2014
[2] Goodman & Beinhacker, Researchers, Bad News is Inevitable, Set Expectations, Quirks MRJ Online, September 11, 2017
[3] John Goodman and David Beinhacker, “No news is NOT good news,” Customer Relationship Management, SOCAP, Fall 2017