
The world is tired of the annual “Do you love us?” survey which starts, “Everything is ok, isn’t it?” as well as the blizzard of transaction surveys we all now receive.
Ironically, at the same time, CCMC’s 2023 National Rage Study (ragestudy@customercaremc.com), showed that more than 21 percent of consumers failed to complain – even once – about their most serious problem over the past year. For less serious product and service issues, only 3 to 30 percent of customers complain anywhere (depending on the issue and product). What actually caused rage was not the lost money, but the long on-hold messages and the hours wasted trying to get the problem resolved.
These same behaviors also apply in the B2B customer experience (CE) but can be even more pronounced in their revenue and word of mouth (WOM) impact. In a study of SaaS users with 560 companies responding, 20 percent of manufacturing and distribution companies did not complain even once about their most serious problem, though their Net Promoter Score was -53. These respondents told a median of 3.4 business associates negative things about the company. If they did complain, many were left dissatisfied, resulting in their NPS rating of -86. Further, they told a median of 7.1 associates about their poor experience. Likewise, a steel company found across 1,100 client companies that 23 percent did not complain and when they did, if left dissatisfied with a response, 50 percent would not purchase again while giving negative recommendations to a median of 3.8 business associates.
What are some innovative ways of getting actionable customer feedback?
Draw on non-traditional sources of VOC data.
Most companies define the VOC as surveys and complaints. Almost always there are other, often timelier, sources of information such as operational data that describe the CE. Two examples will illustrate this.
First, a leading delivery company has operational data that indicates a container of packages missed their connection in Memphis and that 200 packages will not be delivered on time tomorrow morning. This failure will result in 70 complaint calls the next morning and 20 negative surveys the next day. The operational data is not only timelier (in advance of actual problem occurrence) but more accurate in that it shows how exactly many customers were inconvenienced vs. only those who complained. It also provides an opportunity to proactively warn customers.
Second, an insurance company knows that market forces have created a need to increase rates in the Chicago area. The biggest single point of pain for insurance consumers is a “surprise premium increase”. The company can identify everyone who will be getting a surprise increase and arrange to send a letter (objected to by Marketing) 90 days in advance, warning of the impending increase and providing a clear, believable explanation as to why it happened. The result is 80 percent lower anger, higher loyalty, and fewer calls.
Ask about granular problems rather than broad great experiences.
Begin your survey with the question, “When a customer has an ongoing relationship, problems can occur. Please read the following list of 40 problems and note which problems you’ve encountered.” While the Marketing Department is horrified by this question, customers are strongly encouraged and engaged. To quote one of several Harley Davidson customers providing commentary on the survey format, “Finally, someone sent me a no BS survey! It sounds like you really want to solve problems.” Response rates improve because customers are engaged and hopeful.
You then ask if the most serious problem was reported to the company (many are not) and, if so, how well the issue was handled. Now you have the basis for building the economic models described below. Some of the most damaging issues are sales and marketing issues – like “you misled me” or “you did not follow through on promises” – they often do four times the damage but are mentioned or reported much less unless they are included in the problem list. Customers are often too polite to mention them.
The final step is to ask customers who have complained about the problem how well it was handled. Were they dissatisfied, mollified, satisfied or delighted? For all four of these outcomes, as well as for those that did not complain, you should ask about their resulting loyalty, willingness to recommend, and the extent of WOM. A final enlightening question is to ask those associates you told of your experience: How many acted on your recommendation? This allows estimation of the impact of the WOM.
The results obtained from these questions can be arrayed as in the chart below, which is created from an actual survey with several hundred large enterprise respondents.
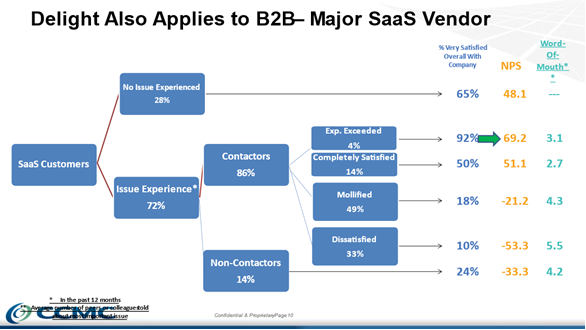
The above chart shows several routinely observed behaviors in the B2B environment. First, a significant minority of customers do not complain but are spreading negative word of mouth. Secondly, when a customer complains and is delighted, the level of loyalty and NPS are significantly higher than if they had encountered no problem. We believe the problem-solving experience cements the image of great service value in the customers’ minds.
Quantify the revenue and WOM impact of all the problems rather than just those complained about.
In most organizations, the focus is either on savings from the reduced cost of complaint handling or, at best, the revenue payoff of those customers who have been saved. The revenue and WOM implications of those customers having problems who do not complain or are not satisfied when they do complain can be 10 to 20 times the cost implications. Therefore, if you select improvement projects based on cost savings, you’re missing the most important projects.
The following chart, based on a leading CPG company, illustrates the relative impact of the complaint handling component of the service unit vs. the potential impact of the VOC business process improvement component.
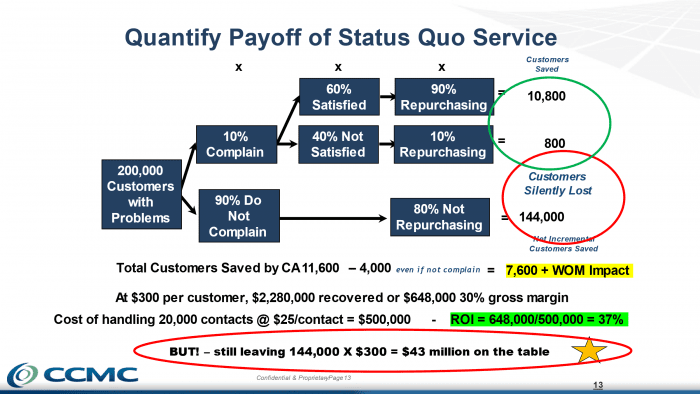
The chart shows that effectively satisfying 60 percent of complaining consumers retains more than 10,000 customers who otherwise would have been lost, recouping over $2.2 million in revenue and producing an ROI of 37 percent on the service investment. While this is admirable, the chart also points out that the other 90 percent of non-complainants signify $43MM in lost revenue — money being left on the table. This $43MM can be won back via improvements in either problem prevention or getting more of those customers with problems to complain. The VOC data allows the service unit to assist product management as well as sales and marketing to reduce the problems customers encounter via product improvement and more transparent marketing.
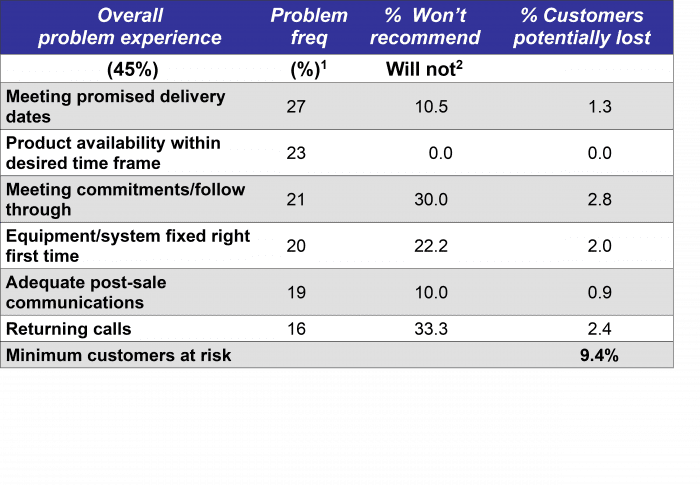
A third example of granular output from a point of pain survey is given in the following chart, based on a commercial communications equipment manufacturer who won the U.S. Baldrige National Quality Award. The chart shows the relative frequency of problems as well as the damage to loyalty of those problems based on the bottom two boxes of a five-point loyalty scale. Meeting promised delivery dates and sales reps returning phone calls are the two most damaging problems.
While the chart shows that 9 percent of customers are at risk due to the top six issues, it also shows that the second most prevalent problem, product availability within the desired time frame, has no real impact on loyalty and therefore does not deserve allocation of resources to fix it. Exploration of the issue found that as long as the longer time frame for delivery was constantly met, the customer did not need the shorter time horizon and no damage to loyalty was done. Some squeaky wheels do not deserve grease.
The above overall problem experience and problem-specific impact calculation is simple enough that CFOs will embrace it. It also suggests three actions the Service, Quality, or Customer Experience Function can pursue: preventing problems, getting more customers to complain so their loyalty can be recouped, and making sure that service systems are responsive to customer issues. A minimum completely satisfied level should be at least 85 percent.
Use these models to calculate how much revenue and profit are being lost for each month that no action is taken. If you quantify the cost of inaction, you precipitate action. For instance, at one auto company, I calculated that an engine hesitation issue was going to cause $50MM in damage over the next year. Management was concerned but appointed a committee to explore it. I then pointed out that each month of inaction would cost an additional $4.2MM in lost revenue. A 90-day committee study would waste an additional $13MM. Management took action to fix the issue in three weeks. If you quantify the cost of inaction, you precipitate action.
Suggest a single executive to lead the effort even if the issue is cross-functional along with process metrics that will indicate if the process has been improved.
Most CE issues are cross-functional, leading to paralysis. If a group of execs is assigned as a group to address the issue, there is no final accountability for action. However, if you as head of VOC/quality suggest or designate a lead function, there is accountability, and things have a much higher probability of getting fixed. Further, if you suggest a possible course of action, you reduce cycle time dramatically. We have found that CE/VOC paired with a Continuous Improvement/Quality function that can do rapid prototyping results in a doubling of the year-over-year increase in customer satisfaction.[1] Finally, by suggesting one or two process metrics that will indicate whether things have actually gotten fixed, you have now created both accountability and a process for enforcing it.
Getting Started Tomorrow
- Identify three data sources describing the customer experience including a survey, service contact data, and at least one type of operational data that can flag operational failures or customer unpleasant surprises.
- Take your CIO to lunch to gain cooperation in gaining advance access to the operational data that describe tomorrow’s CE.
- Identify the average value of the customer so that you can quantify the revenue damage of each customer left dissatisfied.
- Pick one issue that is doing damage to customer loyalty and encourage one function to take the lead — offer to provide support and that they will get the glory from enhancing the CE. Be sure to measure pre- and post-performance to ensure you can document the success.
- Celebrate the success and then move on.
Summary
- Any one VOC data source describing the CE will have flaws. You need to draw upon and integrate multiple sources of data.
- You must raise problems that clients are reticent to articulate – some of the most damaging are the ones least reported.
- Unless you can show the financial impact of ignoring a problem, no one will care. The monthly revenue impact is much more dramatic and effective than just the current out-of-pocket cost.
- Creation of accountability is critical and positive recognition and celebration are much more effective than negative reporting and shaming. Act as an internal consultant who makes execs look good.
Notes
[1] Goodman and Holman, Factors Affecting the Impact of Voice of the Customer Processes, Call Center Pipeline, October 2019
Excellent advice, John. This is an eye-opening report for both B2B and B2C firms to modernize their CXM approaches to 2020s realities. In fact, employee experience managers could add these principles to modernize their playbook.
All “do you love me” surveys should be shelved. They’re not a good use of time and they’re not improving the CX well enough to make a dent in people’s distrust of businesses or nonprofits or governments. They’re not improving the end-to-end CX well enough to pierce the “Good” or “Excellent” category in the Forrester CX Index, nor in many other state of customer experience studies. They’re not improving customer-centricity enough to make more than a trace percentage of companies in the top categories of customer-centricity or CX maturity in any study I’ve seen.
Additional vital practices to modernize are Expectations VoC, CX Annuities, and trust-building emphasis internally and externally. There is so much almost-free VoC that is captured from customers talking to and interfacing with touchpoints. That should always be harvested and acted upon before requesting customers’ precious time to provide feedback that most customers believe will never be acted upon. When you implement these additional vital practices you can actually prevent the need for customer service and churn management for a high percentage of cases, because you’re preventing the issues universally. That makes life better for everyone, including employees and investors.
Lynn: You make two really important points – expectations and feedback on the feedback customers provide.
Most companies skip evaluating expectations setting, when I find it can cause 30% of all dissatisfaction. VOC often even uses phrases like “did not meet my expectations.” Text analytics (or any old human) can easily up those sins.
You say most customer believe the feedback will never be acted upon – we require clients to commit in the survey invitation to provide feedback on what was learned within 90 days of survey submission. While scary to commit, customers love it – both FedEx and Navigant Credit Union got dozens of compliments for “having the guts to report on the feedback” and Chick-fil-A got higher response rates with an invitation that noted, “Based on your feedback, we brought back BBQ sauce.”