I’m delighted to release the 2017 edition of the marketing technology landscape, which we’ve nicknamed the Martech 5000, here at the MarTech conference in San Francisco.
As you’ve probably guessed from that moniker: the landscape grew again this year, by about 40%, to a total of 5,381 solutions (from 4,891 unique companies). You can download higher-resolution versions of this graphic, which you’ll need to zoom into in order to read it:
Marketing Technology Landscape Supergraphic (2017) — 4.6MB slide
Marketing Technology Landscape Supergraphic (2017) — 37.7MB hi-res JPEG
Marketing Technology Landscape Supergraphic (2017) — 61.2MB hi-res PDF
A few important notes, and then I’ll share more stats, analysis, and a final surprise at the end:
- This year, I was fortunate to have Anand Thaker collaborate with me on this project, from the research through to the origami-like folding of thousands of logos into a single slide. I’m incredibly grateful for his contributions.
- We expressly grant permission to reproduce copies of this graphic in any media, digital or physical, as long as it is reproduced “as is” and in full.
- This graphic is only our personal approximation of the marketing technology space and is surely rife with errors and omissions (our apologies). It is intended only to stir discussion.
- Key resources used in our research to build this graphic: CabinetM, Capterra, G2 Crowd, Google, LUMA Partners, Siftery, and TrustRadius. We used these services to discover new companies and to triangulate our categorization. As always, a debt of inspiration is owed to Terry Kawaja, the godfather of vendor LUMAscapes.
It is fascinating to observe the growth of this space over the past 7 years (feel free to look back at earlier martech landscapes from 2011, 2012, 2014, 2015, and 2016):
Statistics from the 2017 Marketing Technology Landscape
The official stats for this year:
- There are now 5,381 solutions on the graphic, 39% more than last year
- There are now 4,891 unique companies on the graphic, up 40% from last year
- Only 4.7% of the solutions from 2016 were removed (and another 3.5% changed in some fundamental way — their name, their focus, or their ownership)
That’s a non-trivial amount of churn, but still for this year, the rate by which new companies were added exceeds the rate by which others were removed.
Of course, not all of the new companies were launched in the year in which we added them to the landscape — many had been around earlier before we discovered them. (And we’re quite sure that there are many others that we missed this year too. Sorry.)
Another interesting statistic is the distribution of their size and funding:
- 6.9% are enterprises, with more than 1,000 employees or are public
- 44.2% are private businesses, less than 1,000 employees or no funding data
- 48.8% are investor-funded startups at any pre-exit stage
So for those who assumed most of these companies are tiny, it’s worth noting that over 300 are enterprises of significant scale. It’s also true that over 2,300 others have received some sort of investor funding — which implies scale beyond a couple of rouge developers in a garage (or, for a more modern-day cliché, two people in a coffee shop).
I’m actually most intrigued by the 2,000+ that are private companies that appear to be fully bootstrapped. I’ve written about the dynamics of modern software and marketing that make this feasible for a few years. But for a second opinion, I highly recommend reading The Rise of Non “VC compatible” SaaS Companies by Clement Vouillon, a research analyst at Point Nine Capital. The barriers to entry are extremely low.
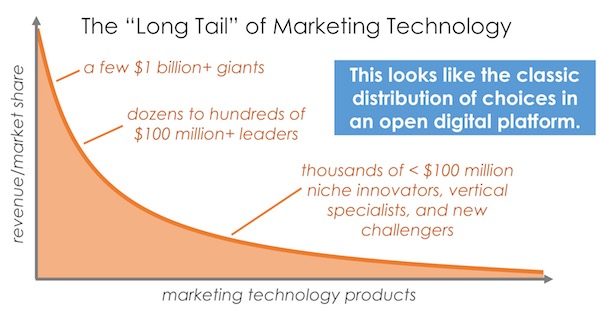
Essentially, this market is a “long tail” distribution of martech vendors: a few $1+ billion giants, dozens of leaders with $100 million or more in revenue, and then THOUSANDS of smaller firms — from 1-3 person micro-SaaS companies to substantial firms with millions in revenue:
The Platformization of Marketing Technology
This long tail distribution above is interesting, because it reflects a pattern that we commonly see in open digital platforms: a few massive blockbusters and a vast stretch of niche offerings. Quintessential examples of this pattern are books on Amazon, music on Spotify, movies on Netflix, apps on Apple’s iOS app store, and so on.
The martech space has been a little different, however, since it wasn’t built up around a specific platform. In fact, most of the major providers downplayed this blossoming ecosystem because they wanted to position their offering as “everything you need you’ll get from us.”
But the spectacular scope explosion of marketing — and the rate at which new disruptions and innovations continue to roil marketing and business at large — has made it impossible for any one vendor to deliver everything that every marketer needs in a digital world.
Almost all of the major providers now acknowledge this, and they’ve shifted their strategies to embrace the ecosystem — becoming true “platforms” that make it easier for marketers to plug in a variety of more specialized and vertical solutions.
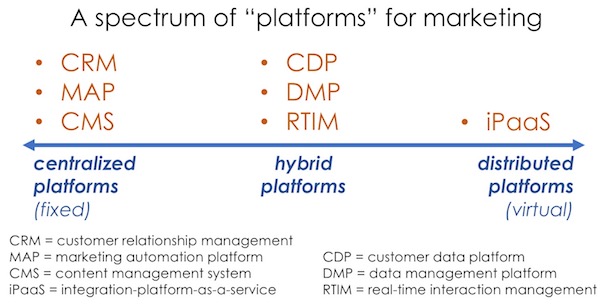
Most of these platforms/suites/clouds — based around CRM, marketing automation (MAP), and content management systems (CMS) — look a lot like classic platforms: they’re centralized repositories of data and services that other solutions plug into. Gartner’s vision of a “digital marketing hub” nicely captures this approach. Adobe, HubSpot, IBM, Marketo, Oracle, Salesforce, Sitecore, etc., are examples of leading centralized platforms.
But alternate approaches to platformizing martech have emerged as well. On the other end of the spectrum from centralized platforms, integration-platform-as-a-service (iPaaS) solutions let companies create “distributed” platforms — dynamically piping data between marketing applications and their own independent marketing data lakes.

While these distributed architectures are conceptually more complicated than a centralized platform, they offer a number of benefits, which I described in the section on microservices in my ebook 5 Disruptions Reshaping Marketing as We Know It — above all, tremendous flexibility to adapt to change. Vendors like Dell Boomi, Informatica, Jitterbit, Mulesoft, Segment, and Zapier are good examples of iPaaS and microservice platform enablers.
And yet another group of platforms sit between these two extremes, blending centralized and distributed philosophies: data management platforms (DMP), customer data platforms (CDPs), and real-time interaction management (RTIM) solutions. CDPs include firms like AgilOne, Lytics, RedPoint, Tealium, Treasure Data, and Usermind. Adobe, Oracle, and Salesforce all offer DMPs, but so do stand-alone vendors such as DataXu, MediaMath, Neustar, Rocketfuel, etc. RTIMs include Experian, Infor, Pegasystems, SAS, and Teradata.
The companies named above are just examples — see the landscape for a more thorough set.
The upshot of this platformization of marketing is that marketers are able to more easily build best-of-breed marketing stacks. Instead of choosing suite or best-of-breed, many marketers are now taking a suite and best-of-breed approach — using the suites as digital marketing hubs and then augmenting them with a range of more specialized products to bake their own, special marketing and customer experience cake.
Remember, marketing is about differentiation.
Instead of choosing suite or best-of-breed, many marketers are now taking a suite and best-of-breed approach.
Here are two great examples of such heterogeneous marketing stacks, from Microsoft and Cisco (click those links for larger illustrations and more detailed explanations of each):
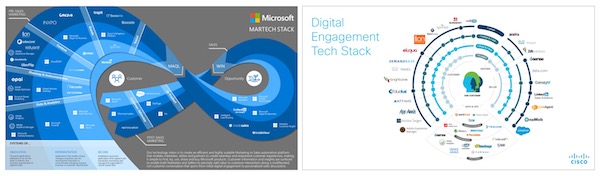
For more examples, check out the other 57 marketing stacks from this year’s Stackies Awards.
I believe that this platformization will steadily reshape the “long tail” of the martech market. There will be increased consolidation when it comes to the core capabilities of coordinating customer data and campaign management. After all, there’s only so many general-purpose MAPs and CRMs the world needs. (Although disruptive challengers will continually arise.)
But ironically, consolidation at the platform level will facilitate greater diversity and innovation at the next level up, as more specialized and vertical market developers build on top of those foundations. As a result, I hypothesize that the martech landscape will remain quite large for some time — but it will increasingly have more structure in how it’s organized, both in the market and in marketers’ operations.
It’s going to continue to be a fascinating space for quite some time ahead.
Spreadsheet of the 2017 Marketing Technology Landscape
As Steve Jobs used to say, “One more thing…”
The number one request I’ve had for the marketing technology landscape — other than “please add my company” — has been, “Could you share a database of these vendors?”
So, thanks to Anand’s help this year, we’re pleased to make a Google sheet of all companies on the landscape, the solutions under which they’re categorized, and their website URLs — freely available to the community:
Feel free to cut-and-paste this data and use it as a starting point for your own research. We’d love to hear about what you discover.
5,000 logos creates confusion. To interpret this ecosystem more information is necessary.
I appended social media followings and available key company data to each of the firms listed in Brinker’s 2016 chart. This information enabled Brinker’s boxes to demonstrate relative concentration within each.
You get quite a different picture this way…generally, a few enormous companies dominate much of the landscape with the rest nibbling for a small share of the market.
Here’s my interactive version of the 2016 infographic: http://bit.ly/2ptdAl4
and the printable static version: http://bit.ly/2qbkVVb
2017 version coming soon…along with which companies have moved up and down