One of the most effective ways to stand from your competition in today’s competitive market is to provide stellar customer service.
By evaluating relevant key performance indicators (KPIs) or call center metrics, companies can gauge how their customers perceive the support they receive from their organization.
This article covers ten essential metrics or KPIs that companies can use to evaluate their customer service performance.
Below are ten essential metrics for evaluating your customer service performance.
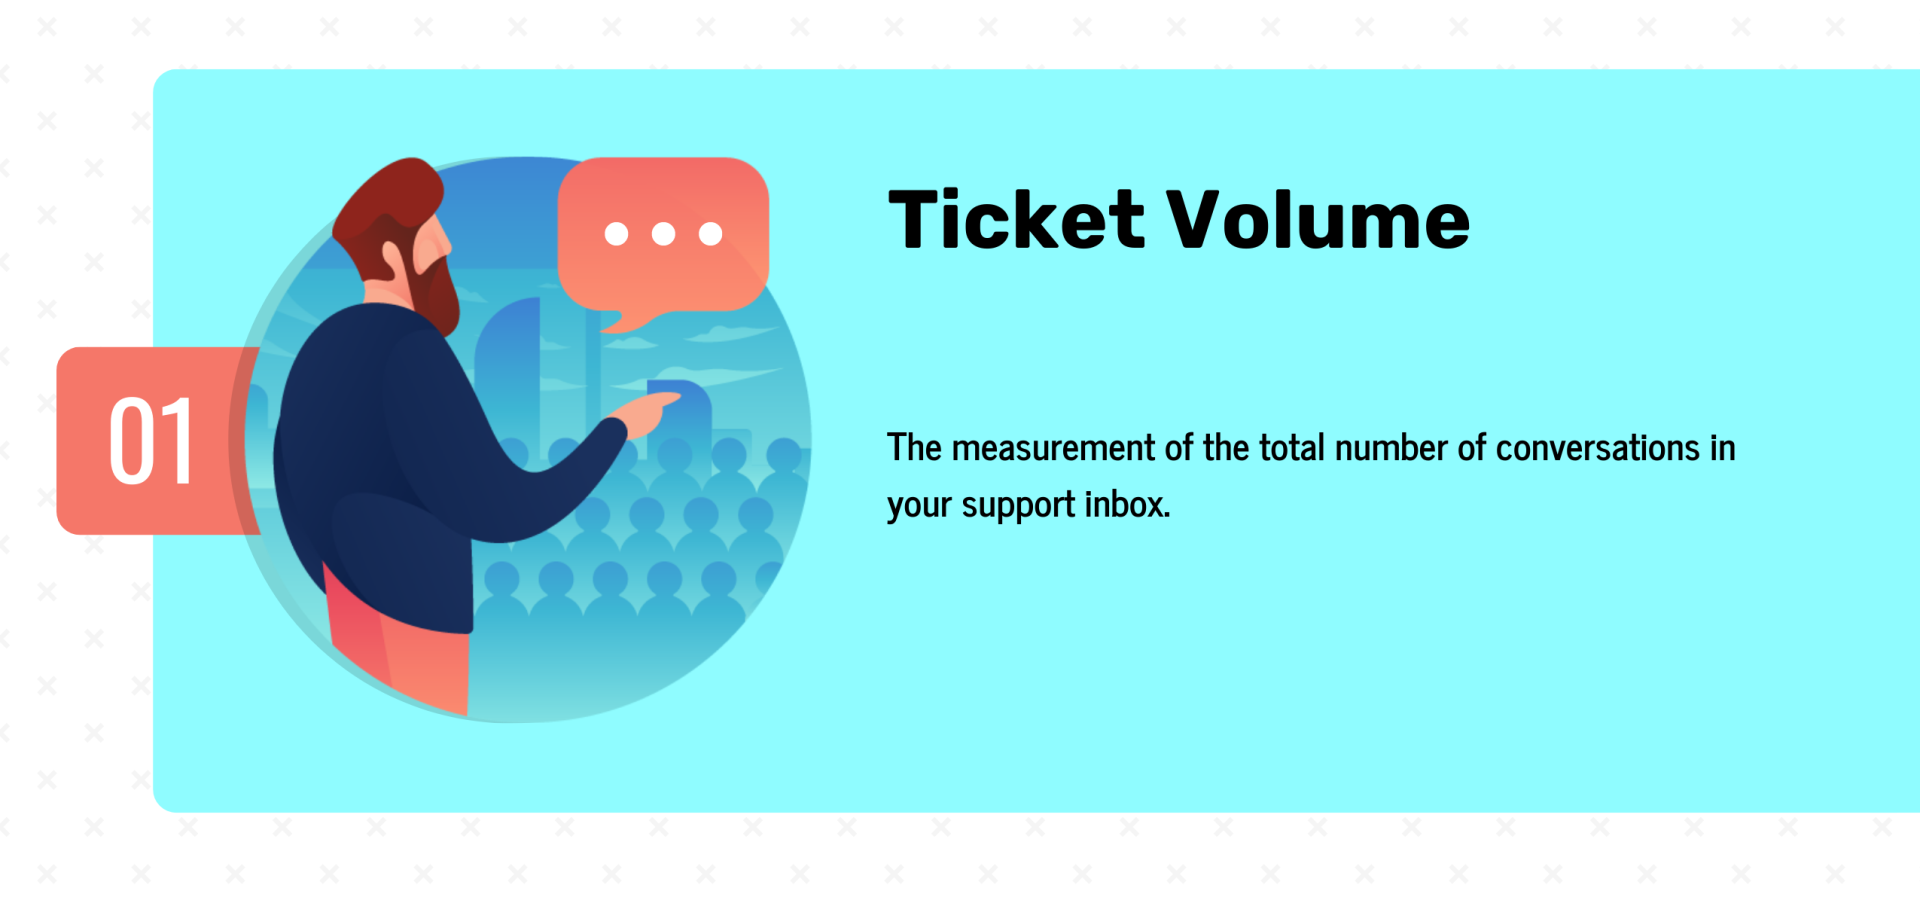
Ticket Volume
Ticket volume has to do with the measurement of the total number of conversations in your support inbox.
Tracking this metric is highly crucial as it helps you determine the precise number of your customers that need help from time to time.
You should also track trends over a specific period to see how or if support or product changes decrease or increase this number.
Best Practices: The best way to significantly improve this particular metric is by offering self-service options.
You will need a knowledge base to achieve this successfully. And an FAQ section will also make a lot of sense and minimize the number of daily calls or emails your support team receives.
If customers can readily find answers to burning questions on their own, they will have no reason to call customer support.
However, ensure these frontline options are as optimized as possible. Keep tracking ticket volumes to see what is working or what requires tweaking.
Customer Service Abandonment Rates
Another significant way to quickly measure customer service satisfaction includes abandoned call rates.
Customers often leave a particular service or brand when they encounter or experience long queue time when they have a question.
It becomes pretty frustrating if customers have to wait too long before getting a response. Time, as they say, is money, and they probably have something else to do with their time.
Many times customers become distracted or preoccupied and forget they are in the middle of an order.
Sending abandoned cart reminder emails, especially when an incentive or discount is included, are often successful in getting customers to return to their cart and complete the transaction.
When you measure this vital customer service key performance indicator, you will discover the strategies you should implement to deliver real-time, top-notch proactive support.
This helps to improve your clients’ experiences and boost your revenues in the end.
Best Practices: Create a chatbot and set staff to take over within 2 minutes. Chatbots are the in-thing these days as they can be programmed to respond to some queries before an actual human support staff takes over.
Therefore, set the chatbot, and ensure the client and the programmed software don’t exceed 2 minutes before a human agent takes over the conversation.
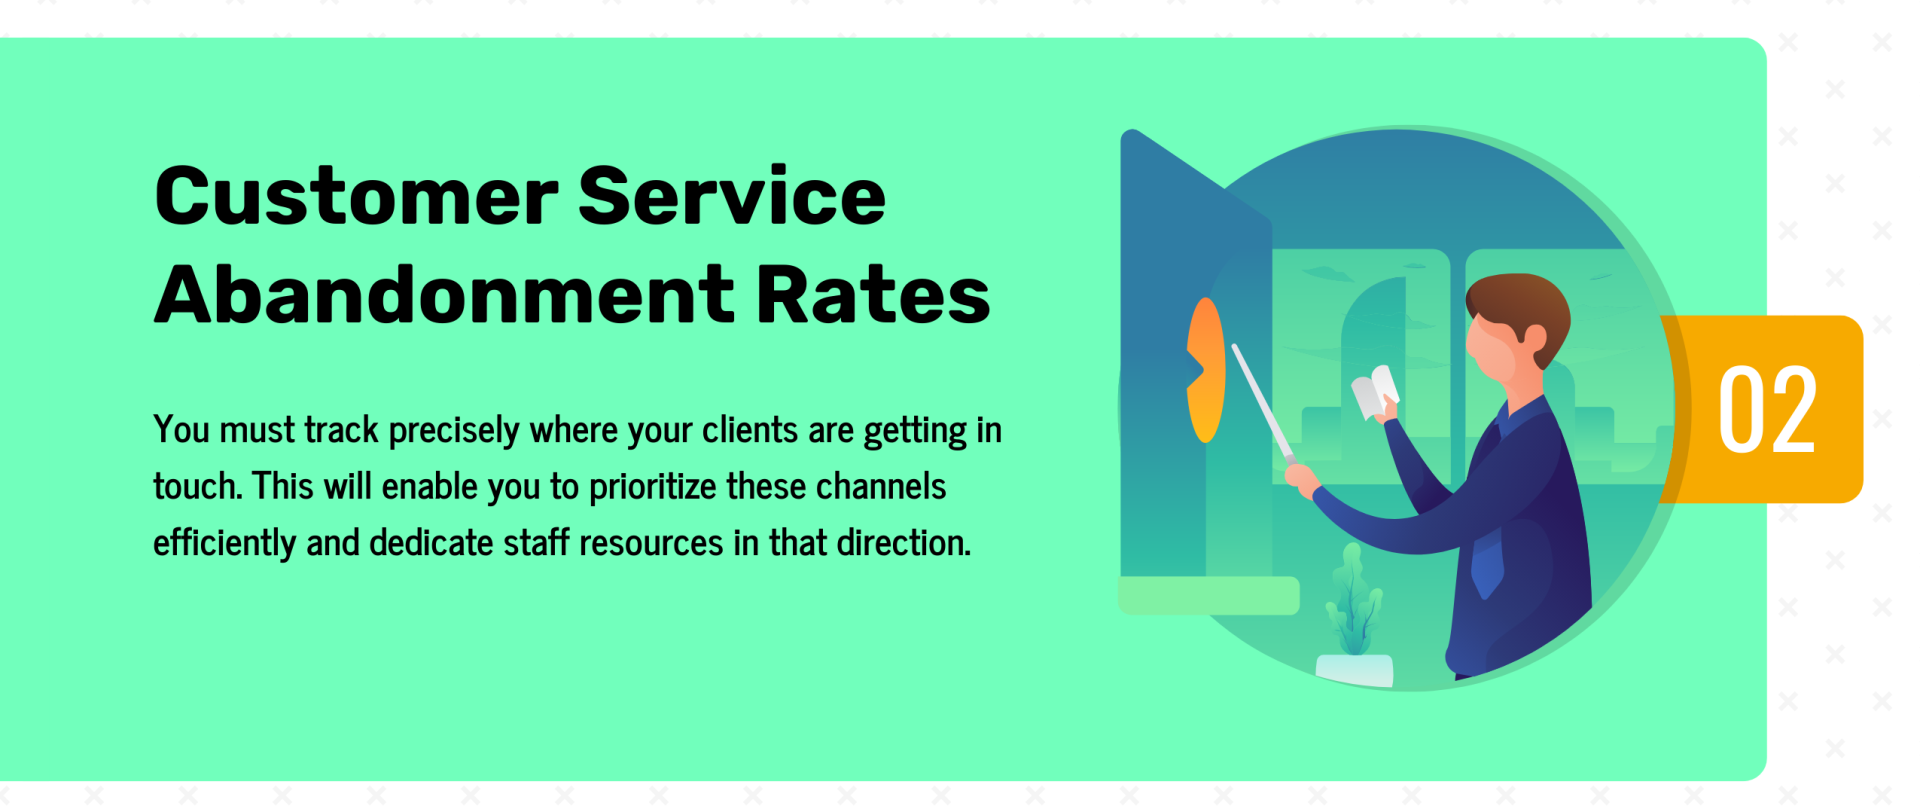
Volume by Channel
You must track precisely where your clients are getting in touch. This will enable you to prioritize these channels efficiently and dedicate staff resources in that direction.

For instance, some organizations de-prioritize customer support emails and now focus on live chat and social messaging.
This is a grave mistake as many customers still prefer email to get in touch with a brand or company.
Best Practices: Do not de-prioritize any communication channel, as long as it is still effective. Give all channels – i.e., live chat, customer support email, social messaging, etc. – the same priority and assign adequate staff to monitor them.
Another option is to hire remote virtual assistants remotely and cut costs for your organization.
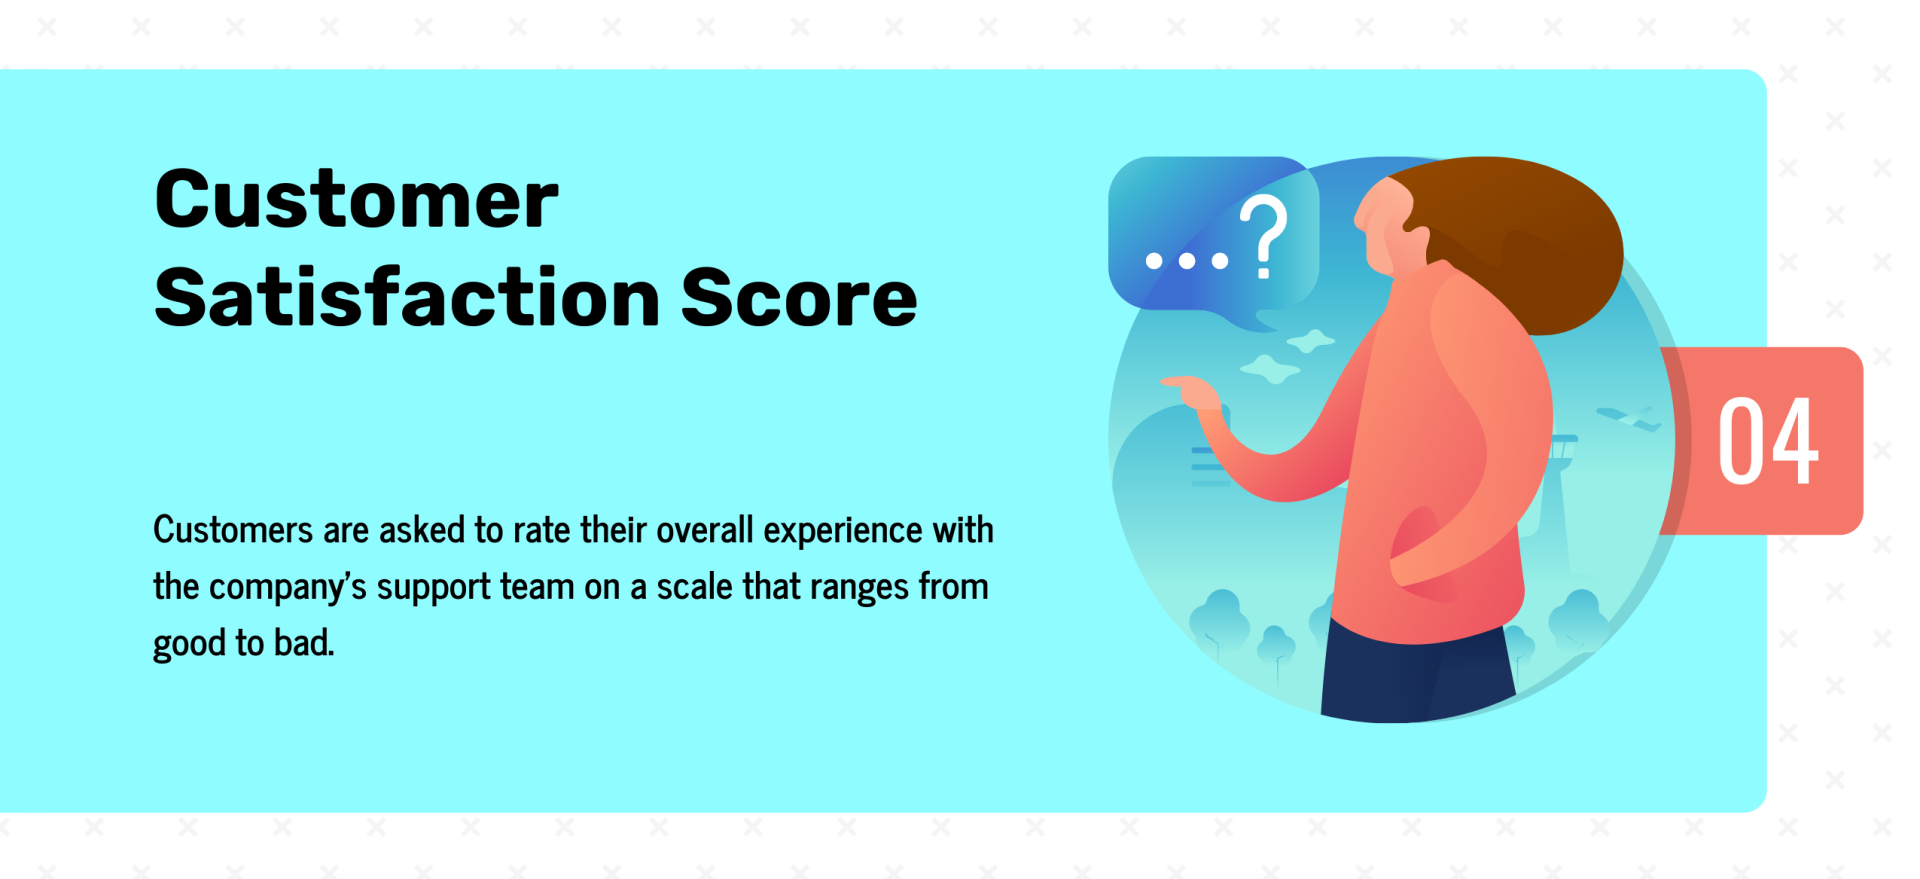
Customer Satisfaction Score
A customer satisfaction score (CSAT) is essential data that reveals whether a particular customer had a good or bad experience. The best way to obtain this data is via a customer satisfaction survey.
The customer satisfaction survey is generally presented right after ticket resolution to gather customers’ sentiments.
Customers are asked to rate their overall experience with the company’s support team on a scale that ranges from good to bad.
The percentage of customers that respond to the survey and the customer satisfaction score is then tracked on a dashboard.
A CSAT of 80 percent is considered excellent in the customer service world. Based on general benchmarks, you should be satisfied with this outcome.
Best Practices: Try offering incentives such as product discounts to get more customers to participate in the survey every month. More participants enable you to raise the CSAT without stress.
You should also consider comparing the scores against the previous month’s report. This makes you see if you need to improve the CSAT score or find out why it is lower if that is the case.
First Contact Resolution Rate
The first contact resolution rate enables the identification of the percentage of total tickets in which you fully resolve an inquiry or conflict within a single response.
Theoretically, most customer service questions can quickly be resolved with one simple answer. But this rarely occurs in reality.
In most cases, support agents require additional data or information to fully understand the customer’s question, which prompts a second email or contact point.
Customers will also likely have follow-up questions they need answers to, and this back-and-forth could go on for some time.
This is a vital metric that should never be overlooked.
Therefore, improving first contact resolution becomes significantly essential, which will boost customer happiness and team productivity.
Best Practices: You may carefully assemble or build a large database of canned responses for common questions. The FAQ section can also come into play here.
Average Issue Count
The quality of your product may be the best in your industry. But you will still receive a few complaints from your customers.
Therefore, it is expedient to calculate the average number of daily, weekly, and even monthly complaint cases as this can come in handy in several ways.
For instance, you will find it easier to develop standard counts across different months, which helps you create relatable benchmarks for your company staff.
Moreover, frequently identifying recurring issues also becomes more manageable, and you can decide whether these issues can quickly be automated or not.
Allocating a particular period – which could be a week or even a month, depending on the volume of tickets you receive per time – makes it easier to keep track of every case you receive within that period.
Best Practices: Find out the number of product or service-related tickets you receive and the reasons behind them.
Your findings will determine whether to polish the aspect of your products with the largest number of complaints or to up the ante of your services.
Tracking everything daily, weekly, and monthly ensures you don’t miss anything. This makes it easier to locate the specific issues customers complain about so you can do something about them.
Net Promoter Score
The Net Promoter Score (NPS) customer service metric is one of the most widely-used tools for gauging the loyalty of an organization’s customer relationships.

It readily measures your customer’s experience as well as assumes the overall growth of your business.
The NPS score helps you know the likelihood of your clients recommending you to their relatives and friends.
It is far less influenced by the customer’s mood, unlike other metrics that only aim at emotion and not at intention.
You can quickly discover your Net Promoter Score by using one simple, but critical question within an index on a scale of 1 to 10: ‘How likely is it that you would refer to the brand?’
Then, categorize the responses of your customers into three distinct categories:
- Detractors (0-6): They are the disgruntled customers who negatively impact your organization or brand via negative word of mouth.
- Passives (7-8): Satisfied customers who are always vulnerable to highly competitive deals and offers.
- Promoters (9-10): These are the loyal customers that will always refer others via word of mouth and will stick with your brand.
You can calculate the NPS by taking the percentage of promoters out of the total respondents and then subtracting it from the detractors.
Best Practices: This excellent loyalty metric is often associated with progressive or increased business growth, which helps you take your brand to the next level in your industry.
CRR (Customer Retention Rate)
According to in-depth research, the average global value of a lost customer amounts to $243. This proves that when you acquire new customers, it significantly enhances your brand image.
If you can retain them for a prolonged period, it shows that you have gained their trust and developed loyalty with several customer retention strategies.
When you have a high customer retention rate, it is often the outcome of a great or highly impressive customer service experience.
Delivering predictable and consistent services helps to significantly increase the lifetime value of the customer.
Best Practices: Ensure you focus on considerably improving your customer retention rate. It should be among the primary customer support metrics to measure and track.
When your brand has a positive image and a high satisfaction score, it invariably increases your customer retention graph.
Average Reply Time
This metric refers to the median amount of time it takes your brand to respond to a customer.
Customers always have incredibly high expectations for reply time. They anticipate follow-ups almost as soon as they send in a support ticket, despite auto-replies and live chat that produce immediate responses.
The image of your brand is positively heightened when you shorten the time between replies. Therefore, set benchmarks and baselines for your customer service team to interpret the perfect time frame your customers expect a response.
Best Practices: Check out the busiest period for all incoming messages from the beginning of the workweek to the end. Then provide sufficient staff during these busy times to minimize reply time.
Your customers will get the attention and assistance they need on time which boosts your brand image.
Replies Per Resolution
Replies per resolution help pinpoint the number of times a customer and an agent go back and forth before reaching a satisfactory solution.
Using the appropriate software, you can track the median number of replies for each resolution, see baselines, and observe abnormalities over time.
If anything happens to skew this critical metric, check it out immediately to find out why. Do more research or brainstorming to discover what you can do to reduce the number of interactions needed to solve issues.
Best Practices: Ensure agents take copious notes to get the complete picture before they reply to a customer. They should respond internally and seamlessly with a manager or team member if they require assistance with a ticket.
Conclusion
So, there you have it: the ten essential metrics for evaluating your customer service performance.
Bear in mind that these metrics alone will not generate satisfied customers. The onus is now on you to take the data points highlighted here – as well as the suggestions made – to build a top-notch customer service performance for your organization.
Set every key performance indicator based on every customer support metric. This will help guide your support staff so they don’t miss the right direction to take or follow.
Consider the suggestions under each essential metric, and let them guide you in enhancing your customer service performance.