Analysis of usage patterns of 16 data science programming languages by over 18,000 data professionals showed that programming languages can be grouped into a smaller set (specifically, 5 groupings). That is, some programming languages tend to be used together apart from other programming languages. A few of the different groupings of languages reflect specific types of applications or specific roles that data professionals could support, including analytics, general-purpose, and front-end efforts.
Data scientists and machine learning engineers rely on programming languages to help them get insights from data. A recent analysis showed that data professionals typically use around 3 programming languages. So, which languages do they use? Are some languages used together? A previous study of data professionals showed logical tool groupings; that is, some tools tend to be used together, apart from other tools. I wanted to focus on programming languages using new survey data from Kaggle’s 2018 Machine Learning and Data Science study in which they collected responses from over 23,000 data professionals on a variety of data science practices, including their use of 16 different programming languages.
Dimension Reduction through Principal Component Analysis
I used a data reduction approach called principal component analysis to help determine which programming languages tend to be used together. This approach groups the languages by looking at the relationship among all languages simultaneously. In general, principal component analysis examines the statistical relationships (e.g., covariances) among a large set of variables and tries to explain these correlations using a smaller number of variables (components).
The results of the principal component analysis are presented in tabular format called the principal component matrix. This matrix is an NxM table (N = number of original variables (in this case, programming languages) and M = number of underlying components). The elements of a principal component matrix represent the relationship between each of the languages and the underlying components. These elements represent the strength of relationship between the variables and each of the underlying components. By analyzing language usage, the results of the principal component analysis will tell us two things:
- number of underlying components (programming language groupings) that describe the initial set of programming languages
- which languages are best represented by each programming language grouping
Results
This use of principal component analysis is exploratory in nature. That is, I didn’t impose a pre-defined structure on the data itself. The pattern of relationships among the 16 languages drove the pattern of results. While human judgment comes into play in the determination of the number of components that best describe the data, the selection of the number of components is based on the results. The goal of the current analysis was to explain the relationship among the 16 languages with as few components as was necessary. Toward that end, there are a couple of rules of thumb that I used to determine the number of components using the eigenvalues (output of principal components analysis). One rule of thumb is to set the number of components based on the number of eigenvalues greater than unity (1.0). Another way is to plot (called a scree plot) the 16 eigenvalues to identify a clear breaking point along the eigenvalues.
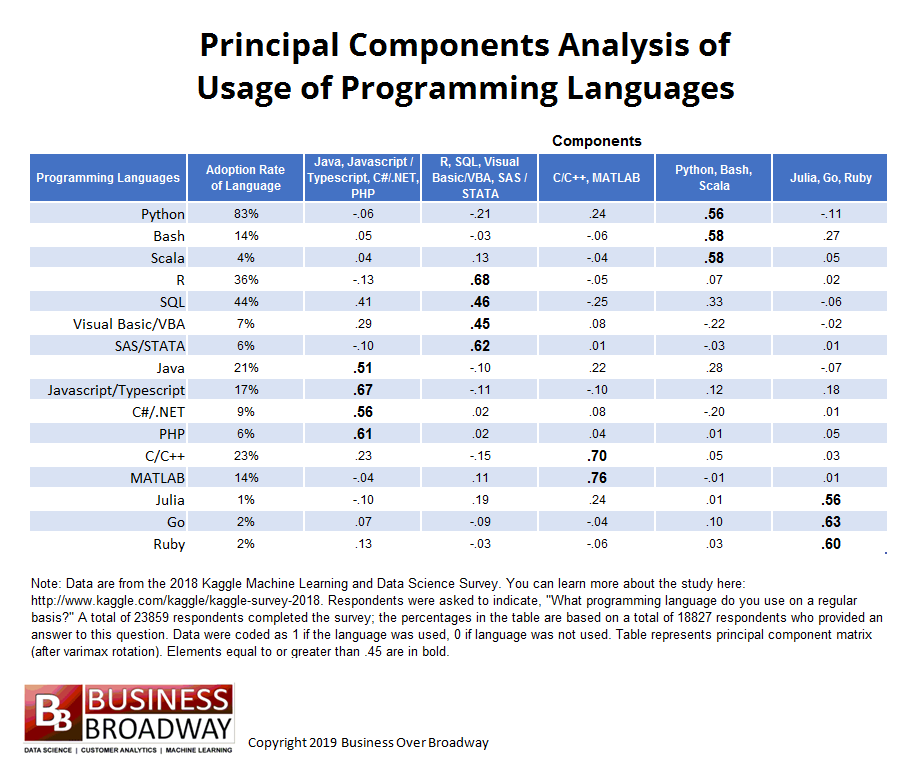
Table 1. Principal Component Matrix of 16 Programming Languages – data from Kaggle 2018 Machine Learning and Data Science survey of data professionals. Click image to enlarge.
The plot of the eigenvalues appeared to break around the 5th and 6th eigenvalue. Also, there were 5 eigenvalues greater than unity. Therefore, I chose a 5-factor solution to explain the relationships among the 16 data science tools.
Based on a 5-factor solution, the principal component matrix (see Table 1) was somewhat easy to interpret. Some of the cell values in the matrix in Table 1 are bold to represent values equal to or greater than .45. The components’ headings are based on the tools that loaded highest on that component. For example, three languages (e.g., Python, Bash and Scala) loaded highly on component 4, showing that usage of these languages by a given respondent tend to go together (if you use Python, you tend to use the other(s)); as a result, I labeled that component as Python, Bash, Scala. Similarly, based on the tools that were highly related to the other 4 components, the other 4 components were labeled accordingly.
Programming Language Groupings
The results suggest that 5 tool grouping describe the data well. I’ve listed the 5 groupings below by including the specific languages that describe each grouping. Recall that languages that fall within a specific group tend to be used together.
- Python, Bash, Scala
- R, SQL, Visual Basic/VBA, SAS/STATA
- Java, Javascript/Typescript, C#/.NET, PHP
- C/C++, MATLAB
- Julia, Go, Ruby
There was one programming language that did not clearly load on a single component: SQL. It appears that SQL is associated with three programming language groupings. SQL use is moderately related to the use of Python (component 4), Java (component 1) and R (component 2).
The use of specific programming languages tend to occur together. Based on the current analysis, the 16 languages studied can be grouped into a smaller subsets of tools. It appears that the groupings are driven by the functionality of each programming languages. Specifically, Python, along with Scala and Bash, are general-purpose programming languages. However, the component including R, along with the other respective languages, support analytics efforts. The component including Java, Javascript/Typescript and other respective languages support web or front-end application efforts. The commonality among the least popular languages might reflect those data professionals who may be programming language enthusiasts.
Aspiring data professionals and seasoned data professionals, to improve their chances of landing a job or succeeding in data science projects, respectively, need to learn or select the right programming languages for the role that they will play in data science projects. No single language will do it all and data professionals will likely need to use a set of related programming languages in their data projects. The current results suggest that data pros might want to consider learning/using several programming languages within components as potential candidates to include in your arsenal, focusing on a specific data science role.