
Today, customer experience measurement has reached mainstream acceptance and its adoption is the result of proven experimentation by the many pioneers of online customer satisfaction research. One of the most hotly debated questions when discussing customer experience measurement is, ‘what metrics are the best?’
To date, much of the learning regarding metrics is centered around what works best for a particular business and its objectives. One thing is for certain though: multiple, short, concise and intelligent conversations with customers are the key to successful customer experience analytics. Long gone are the days of lengthy, one-size-fits-all, single surveys as a means of collecting customer feedback.
While there are an infinite number of metrics that can be used as part of a customer experience program, there are a few key metrics that should be leveraged to get any program off the ground.
Four of the most widely leveraged and useful customer experience metrics are Satisfaction, Net Promoter® Score, Visitor Intent, and Task Completion. In this post, I will share my 20+ years of hands on experience using these key metrics and the best ways to implement them to ensure accurate and consistent results. As my grandfather would say, “There’s more than one way to fillet a fish.” Therefore, my insights should serve as a guide but, obviously, there are many different ways these metrics can be implemented successfully.
Satisfaction
Satisfaction is an essential metric in measuring and managing the customer experience over time. Satisfaction is used to provide a baseline measurement of performance, identify change, and understand key drivers to set and align priorities at an organization level. If you are not measuring satisfaction of the overall experience already as part of the customer experience program, you should start.
How to collect Satisfaction
Traditional customer satisfaction research dates back to the mid 1960’s. In the late 1990’s, with pioneers like my mentor, Dr. Max Garfinkle and his diagnostic solution the Capability Snapshot, online research methodologies were introduced. One of the methodologies that I helped to create with Dr. Garfinkle was the pre/post random sampling engagement methodology. This method invites a visitor on-arrival to provide feedback at the end of their experience to produce reliable and reproducible results and this would be my preferred method for running an on-going tracking study.
There are many questions and groups of questions that you can ask to gauge customer satisfaction. I prefer using an overall experience question. Overall experience is the ideal dependent variable for multiple regression analysis of attributes of the experience that can be used to determine independent drivers of satisfaction. The construction I favor is the following:
“How would you rate your overall experience today?”
While there are many opinions about what scales to use for digital collection, and they are all fiercely held, I prefer a 0-10 point numeric scale with six offset labels for collecting feedback on satisfaction. In addition to the offset of the labels, which reduces text and numeric bias, the extreme positive point, labeled ‘Outstanding’, is set apart to reduce the positive skew associated with scales that use 9 or more points. You can see an example of offsetting the extreme positive point below.

iPerceptions research has shown that this scale produces results with closer to normal distribution than scales using 9 to 11 points with end point labels and scales that use direct 1 to 1 labels. Given that one of the principle assumptions of most statistical analysis is normal distribution of data, statistical results from using this scale produce more reliable and more reproducible results.
Net Promoter® Score
Net Promoter Score (NPS) provides a read on how your customers feel about your company. It is a customer loyalty metric developed by Fred Reichheld, Bain & Company and was introduced by Reichheld in his 2003 Harvard Business Review article “One Number You Need to Grow“.
One of the biggest advantages of the NPS is its simplicity, while still being relevant to all levels and functions of an organization. Also it has been shown to be a good leading indicator of overall company performance.
Some of the clients I have worked with have successfully used the NPS metric as a beachhead, eventually leading to the adoption of a more sophisticated metrics and a data-driven culture that permeates throughout the organization. If you need a starting point, a single metric to lead analytic adoption throughout your organization, consider the NPS.
How to collect the Net Promoter Score
The Net Promoter Score is derived from asking the following question –
How likely is it that you would recommend [brand] to a friend or colleague?
The most accepted method for collecting NPS is using a 0-10 point scale with end point labels – See below for an example.

To calculate your NPS, respondents are grouped in the following categories:
- Promoters (score 9-10) – Loyal enthusiasts who will keep buying and refer others, fueling growth
- Passives (score 7-8) – Satisfied but unenthusiastic customers who are vulnerable to competitive offerings.
- Detractors (score 0-6) – Unhappy customers who can damage your brand and impede growth through negative word-of-mouth.
Then by subtracting the percentage of Detractors from the percentage of Promoters you arrive at your Net Promoter Score, which can range from a low of -100 (if every respondent is a Detractor) to a high of 100 (if every respondent is a Promoter).
NPS is not without its limitations and critics, however it remains a useful and simple metric that can be easily implemented.
Visitor Intent and Task Completion
Digital touch points are the most measurable sales and service channels. With huge amounts of data already existing on what visitors are doing on desktops, mobiles and tablets. Behavioral web analytics, is a well-recognized form of measuring performance and provides valuable decision support to help optimize online channel offerings. However, behavioral metrics like ‘pages visited,’ ‘time on site’ and ‘conversion rate’ provide little insight into the hearts and minds of customers. What’s missing is the insight gained by listening to actual visitors, as they can provide the ‘why’ behind the ‘what’. Uniquely, customers can provide feedback in the context of their intentions; they can also let you know whether or not they could complete their desired tasks.
The introduction of ‘Intent’ and ‘Task Completion’ as key customer experience metrics, represents a ground shift in satisfaction research, away from periodic and expert analysis of customer satisfaction studies, towards the ongoing data driven world of digital analytics. Avinash Kaushik brought attention to the need for these metrics within digital analytics in his 2007 blog post, The Three Greatest Survey Questions Ever. In 2008, iPerceptions responded to Avinash’s challenge to provide a simple and easy to deploy website survey solution for web analytics practitioners called 4Q.
How to collect Visitor Intent
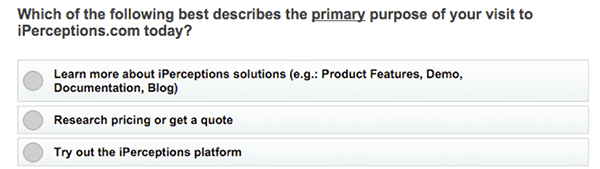
For collecting Visitor Intent, consider using a ‘Purpose of visit’ (PoV) question –
“Which of the following best describes you primary purpose?
A single select format is preferred for the response. Avoid the use of multiple select options for the response, as this defeats clear segmentation and complicates analysis with no real benefit. The main goal is labeling visitor behavior with their stated intent exposing the ‘why’ behind the ‘what’ of behavioral web analytics. The number of possible responses for a ‘single select’ question is ideally 6 or less. More choices require too much effort by the respondent and can make it difficult for them to clearly identify and easily choose the appropriate answer. Below is an example of a purpose of visit question that we use on the iPerceptions.com website.
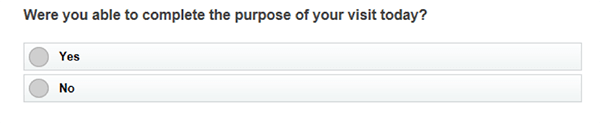
How to collect Task Completion
For the metric ‘Task Completion’, I recommend a binary response of Yes or No (See below for an example). I am not a fan of ‘Partially’ as an option, as this generally muddies the waters and introduces additional subjectivity with no increased insight. Labeling customer behavior with ‘Failed Task Completion’ provides a strong signal within the behavioral data that allows web analysts to easily isolate and identify issues that need to be addressed.
Turning metrics into action
Up until recently, customer experience analytics were solely diagnostic in nature, meaning we analyze what customers do and say in the past to improve their experience in the future. Tracking and monitoring the visitor experience is often the starting point for customer experience programs. Essentially, you need to measure to manage in order to improve. But if we can make better decisions in a diagnostic fashion, the next challenge for customer experience analytics becomes, can we recognize visitors’ intent and personalize the experience by aligning engagements and content to their needs as they occur.
The challenge for customer experience metrics has always been that they are collected at the sample level, and can only be applied to the overall population or audience by translating these analytic insights into informed decisions for marketing programs, usability, design, and strategy.
However, leading edge research done by iPerceptions shows that a small representative sample of customers’ stated intentions and related behavior can be used to better recognize the intentions of customers who have never answered a survey. In essence, this technology creates a strong behavioral signal to better recognize customer behavior based on ‘stated’ rather than ‘inferred’ intentions. This is the next evolution of customer experience analytics scaling for the first time the value of customer experience metrics to the coverage and velocity of behavioral data to drive personalization.
Customer experience metrics are a key foundation of any customer experience program but just storing and hording results will not have any impact on the experience. It is only when the results move to inform decisions and start being used to personalize the experience in real-time that metrics can improve the customer experience and ultimately, increase loyalty and retention.
* NPS®, Net Promoter® & Net Promoter® Score are a registered trademark of Fred Reichheld, Satmetrix, and Bain & Company.
Image source – PicJumbo
Acknowledged: “Today, customer experience measurement has reached mainstream acceptance and its adoption is the result of proven experimentation by the many pioneers of online customer satisfaction research.”
Challenged: The metrics you’ve identified are the 4 most important in customer experience, in part because none of these measures or KPIs incorporates the impact of subconscious thinking, emotion, and memory in downstream action.
– Satisfaction has long been proven to be a tactical, superficial, attitudinal and transactional measure, with low and inconsistent connection to customer behavior.
– The array of NPS limitations cited in your hyperlink (plus several more, unidentified) render this metric ineffective as a KPI. Certainly, because of its lack of granular application, many companies see NPS flatline after addressing low-hanging experience fruit, and find it difficult to progress beyond.
– Visitor (or customer) intent has value, but it needs to be embedded within a framework that incorporates other key elements such as brand favorability, prior experience, consideration set, word-of-mouth volume and tone, etc.
– Task completion is more transactionally-oriented, and taking a binary approach in measurement somewhat handcuffs actionability. For example, maybe my customer service issue was (or issues were) handled in a positive, neutral, or negative way, but, as a vendor, I’d need and want to know why the customer put this label on it.
The variables you mention are not independent. These four are generally highly correlated. I would llke to see four independent measures.
Thanks Michael for the comment. I understand your concerns and acknowledge that there many other CX metrics all with their specific challenges. In no way was this post intended to be an exclusive or exhaustive list. The 4 metrics described in this article, in my experience, including satisfaction and NPS, have been used successfully by many companies as key metrics, to measure, manage, and improve their customer experience.
In the context of metrics that are truly reflective of customer behavior, “succesfully” is, I guess, a relative term. Over time, many companies grow comfortable with their antecedent metrics, even when there are more real-world and actionable measures available. They rationalize use of metrics like satisfaction and NPS. Satisfaction is largely attitudinal, not emotional, and gives little guidance re. customer behavior. NPS, among its troublesome and extensive list of actionability challenges, is macro in nature, not granular; and even measures like tone and frequency of brand word-of-mouth drive more customer behavior.
Hi Duff,
So sorry to rain on your parade, but I need to point out that many companies that have fallen in love with NPS and the work of Bain and Co have a bias which has affected their neutrality. I am really surprised that you have excluded the work on Customer Effort Score, (CES.) While NPS is a better measure of loyalty than customer satisfaction, the work on Customer Effort Score published in the Harvard Business Review and a later book shows that CES is a far superior metric for predicting customer loyalty. The work of Prof Moira Clark and the Henley Centre for Customer Management (HCCM) has taken this research further, and confirms how reducing customer effort is very powerful in today’s complex world. I am happy that you and Michael pointed out the weaknesses/limitations in the NPS approach, but I’m ever more delighted that you have sparked a nice debate.
Deep down in my brain, I’m also uncomfortable that we (including me,) try to simplify the complexity of customers into simple formulae for our clients. Sometime we need to sit down knee to knee and jaw to jaw with them in order to truly understand who they are and how they respond to our businesses. Completely unscientific – but then so are love and human relationships.
Great post.
Thanks for a great post!
I agree about the Customer Effort Score (CES). Customers for sure want to do more with less, so the better a company performs the task, the more loyal customer they get in return. I would pay particular attention to this metric.
As for CX measurements, some researchers also mention the importance of developing a CX measurement model (like the one described here https://www.scnsoft.com/blog/in-search-of-an-effective-model-to-measure-customer-experience). The key idea is to identify a list of factors that are crucial for target audiences of a particular company. Then those factors are used to calculate overall negative impact and how it correlates to financial returns. If the negative impact indeed brings losses, a company can drill down to the factors and understand which actions to take.