In my last published article, Customer Journey Mapping, Understanding how customers think, feel and experience, a number of readers wanted to know more about how to capture customer emotion and how to visualise the emotion in mapping their customers’ journey.
The connection between emotions and feelings
In his most recent book, Mama’s Last Hug, primatologist and ethnologist, Frans de Waal explains that emotions are as much a part of the body as they are of the mind. Think of emotions as mental and feelings as physical—we know when we are angry because we feel it.
De Waal explains the connection between emotions and feelings, “Feelings arise when emotions penetrate our consciousness, and we become aware of them”. Emotions are, “… mental states that make our hearts beat faster, our skin gain colour, our faces tremble, our chests tighten, our voices rise, our tears flow, our stomachs turn, and so on.”
Emotions and Customer Experiences
Customer experiences are inherently human. Experiences are how we feel and what we remember; they are the key moments in our lives and the basis for the stories we share. The experiences we have, shape our attitudes, thinking and behaviour. How we interact with the brands we bring into our lives, our customer experiences, impacts how we feel and can have a positive, neutral or negative impact on our lives.
An HBR article* argues that “Emotionally connected customers are more than twice as valuable as highly satisfied customers. These emotionally connected customers buy more of your products and services, visit you more often, exhibit less price sensitivity, pay more attention to your communications, follow your advice, and recommend you more – everything you hope their experience with you will cause them to do.”
Listening for customer emotions
As described in my last article, Customer Journey Mapping is the process of listening to understand the customer perspective, synthesising this data to understand its meaning, visualising what customers are thinking, feeling and doing, and using storytelling to communicate the customer’s experience.
Listening to customers tell their story about their experience requires first-hand customer conversations using contextual enquiry research or in-depth customer interviews. These are qualitative research techniques that enable a one-to-one conversation, directly speaking with customers to gain a deeper sense and understanding of their world, context and their experiences with an organisation.
Your aim in asking questions is to better understand your customers’ stories; their needs, goals, how they perceive their experience with you and their struggles and disappointments. In undertaking these discussions you’ll also be asking customers about the emotions associated with their experience to learn how they felt and ‘why’ at each stage, touchpoint or interaction in their journey.
You’ll be actively listening to their language; the specific words used to describe their experience, their tone of voice and how they express themselves. In fact, a recent study by Michael Kraus, Yale University School of Management, found that our hearing may be stronger than our vision in detecting emotion.
Kraus argues, “When you are speaking to someone on the phone, for example, you might be more likely to notice if they are breathing quickly and appear nervous, or if their speech is monotone and they sound down or tired. On the other hand, you can easily detect enthusiasm and excitement when someone speaks in a high-pitched and rapid manner.”
In my many years in the field, talking with and listening to customers, I have found that these discussions reveal illuminating discoveries – customer intelligence and insights that could not possibly be discovered from using customer satisfaction surveys alone.
Making sense of all the data
Affinity clustering is a sorting method used to organise all of your customer discussions, observations, thoughts, emotions and customer actions according to their similarity, relevancy and importance.
The method encourages critical thinking, enabling a team or CX working group to bucket qualitative data into patterns or themes – these themes are used to translate qualitative research into findings and actionable customer insights.
Using this analysis method, sort conversations into clusters by customer journey stages, steps and what customers are thinking, feeling and doing during their interactions. In synthesising this data into clusters, themes emerge and it is at this point that customer emotions are identified and tagged.
Emotions on a Customer Journey Map
Most of the time we’re not aware of our emotions, and often we can have trouble putting our feelings into words—unless there’s a heightened emotional moment. Across the customer journey, emotions act as a highlighter, emphasising the memorable aspects of an experience.
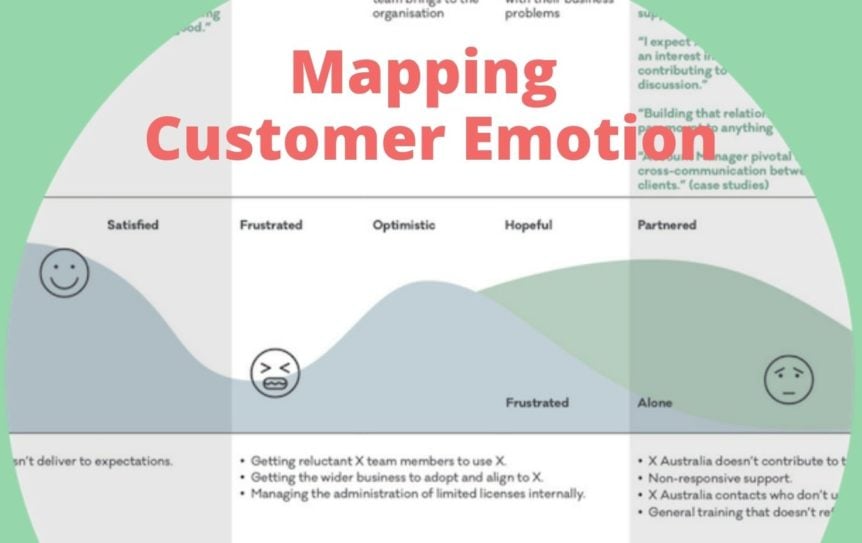
Customer emotions on a journey map are expressed visually using an emotion graph. An emotion graph visualises customer sentiment, i.e. how customers feel at each interaction. Emotion icons or emoticons are a picture or image representation of facial expressions indicating a particular emotion—such as a ‘smiley face’ emoticon to indicate happiness. Emotion icons and a graphic wave are used to show the customer’s emotional highs and lows from the journey beginning to end.
Emotions on the customer journey map are also communicated through customer verbatim comments. While the emotion graph uses visual storytelling, verbatim comments engage using the customer’s own voice, words and expressions; summing up the aggregated customer perspective.
In using customer language, what will be noticeably absent in your customer journey mapping is the ‘corporate speak’. In my years in the field this is one of the most noticeable gaps between the organisation and the customer; the differences in how each communicates.
Emotions are communicable
Just as we can’t help feeling happy when another person is happy, or we get upset and cry when we watch a sad movie, employees can’t help but feel customer emotions. Emotion graphs help customer emotion to jump from one person to another and enable employees to feel what customers are experiencing. It is empathy that facilitates us ‘feeling’ together, understanding another’s point-of-view and enabling us to customer perspective-take in our thinking and decision making.
Many times over I’ve experienced the ‘light go on’ for executive and employee teams; their customers’ stories evoking an emotional response that had a profound effect on them. I have seen them leaning into the journey maps stretched along boardroom walls. Huddled in small teams, I hear them reading and discussing their customers’ verbatim comments aloud; tracing their fingers over the emotion graph to feel what their customers were feeling.
Customer journey maps make the complex simple
A customer journey map visually communicates the customer’s experience; each step they take, their goals, and what they’re thinking, doing and feeling—their emotions across each interaction. A journey map is a powerful framework, simply and effectively communicating the experience; how customers feel, so that it can be clearly understood by all, aid in fostering meaningfully connection and bring new perspectives to the decision-making table.
First published on alexallwood.com.au
*An Emotional Connection Matters More than Customer Satisfaction
by Alan Zorfas and Daniel Leemon, HBR