
Summary: The first two posts in this series described my scoring for product fit. The third and final post describes scoring for vendor strength. And I’ll give a little preview of the charts these scores produce…without product names attached.
Beyond assessing a vendor’s current product, buyers also want to understand the current and future market position of the vendor itself. I had much less data to work with relating to vendor strength and there are many fewer conceptual issues. From a buyer’s perspective, the big questions about vendors are whether they’ll remain in business, whether they’ll continue to support and update the product, and whether they understand the needs of customers like me.
As with product fit, I used different weights for different types of buyers. As you’ll see below, the bulk of the weight was assigned to concentration within each market. This reflects the fact that buyers really do want vendors who have experience with similar companies. Specific rationales are in the table. I converted the entries to the standard 0-2 scale and originally required the weights to add to 100. This changed when I added negative scoring to sharpen distinctions among vendor groups.

These weights produced a reasonable set of vendor group scores – small vendors scored best for small buyers, mixed and special vendors scored best for mid-size buyers, and big vendors scored best for big buyers. QED.

I should stress that all the score development I’ve described in these posts was done by looking at the vendor groups, not at individual vendors. (Well, maybe I peeked a little.) The acid test is when the individual vendors scores are plotted — are different kinds of vendors pretty much where expected, without each category being so tightly clustered together that there’s no meaningful differentiation?
The charts below show the results, without revealing specific vendor names. Instead, I’ve color-coded the points (each representing one vendor) using the same categories as before: green for small business vendors, black for mixed vendors, violet for specialists, and blue for big company vendors.


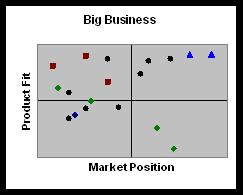
As you can see, the blue and green dots do dominate the upper right quadrants of their respective charts. The other colors are distributed in intriguing positions that will be very interesting indeed once names are attached. This should happen in early to mid January, once I finish packaging the data into a proper report. Stay tuned, and in the meantime have a Happy New Year.


David
This work is very interesting.
I expect that our Austalian market is behind the US in awareness of marketing automation and the possibilities. But 2011 is shaping as a year we move from early adoption to broader adoption. Clearly the b2b marketers (at least the ones we deal with) are looking for more effective lead nurturing, lead management, better qualified sales-ready leads and closed-loop outcomes/ROI reporting.
Integrated marketing automation technology is required to do this – cant be done with email broadcast tools and XL sheets any more !
Look forward to seeing your report.