
One of the most controversial and challenging areas of any revenue engine is the hand-off process from marketing to sales. It is this transition that bears the brunt of all the inter-organizational process differences, motivation differences, and politics. This makes it a vital area to focus on in building the benchmarks and dashboards that will help optimize overall performance.
The nurturing and discovery of qualified leads, while vitally important, is of limited value unless the hand-off to sales is efficient and optimized. As this aspect of the process involves a significant behavioral element in the managing of sales team engagement with the lead flow process, it can be the source of many easily remedied revenue engine challenges.
The first aspect of understanding this element of the process is to understand the volume and quality of leads flowing to each territory. Volume is, of course, a simple metric to dashboard, and volume differences by territory can be quickly identified.
Quality, however, is often a more important indicator of eventual success. While MQLs may be defined as any lead that falls into a fit and engagement profile that defines it as an A1, A2, or B1, this does not mean that all MQLs are equal. Understanding the quality of leads passed to each territory is vital in ascertaining whether any revenue challenges being seen are a result of poor team performance or poor lead quality.
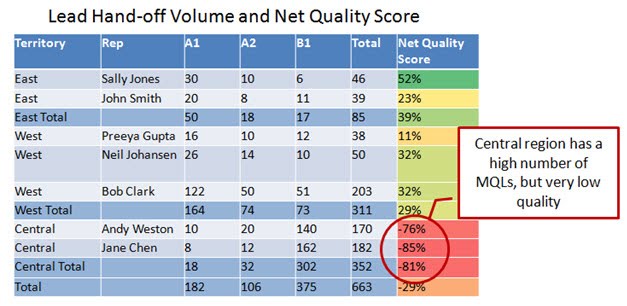
Most useful in this is a metric called the Net Quality Score that indicates the overall balance of high and low quality leads being sent to each rep or territory. To calculate the Net Quality Score, first split leads into high (eg A1s), medium (eg A2s), and low (eg B1s and B2s) categories. The Net Quality score is the number of high quality leads minus the number of low quality leads, divided by the total number of leads. Scores can range from -100% to +100%, and higher scores indicate a higher average lead quality.
This quality score can quickly pinpoint issues, for example in the following dashboard, it can be seen that while the Central region is receiving a large number of leads, they are generally of very low quality. This may result in sales team effectiveness that is much lower than expected without being the fault of the sales team in terms of performance.
What Happens After the Handoff?
With this understanding of which territories, product lines, and salespeople are provided with leads, and of what average quality, the next step is to provide insight into the outcome of those leads. Done properly, the disposition of leads by a sales team after they attempt to connect with them should not only trigger a marketing process to correctly handle the leads, but also provide clear insights into the whether any fine tuning of the qualification process may be required. If the leads were unreachable, lacked interest, were not the right role, or only had early stage interest, this insight allows marketing to see whether there are potential quality issues with their leads.
Likewise, if certain sales reps are doing a poor job in following up with the leads they are given, this will also show up in the analytics of lead disposition when a MQL to SQO conversion ratio is calculated for each sales person. In the following lead disposition chart, for example, you can see that Bob, Andy and Jane received a large number of leads, but failed to convert many of them to opportunities, instead marking them as unable to connect. Worth noting, however, is that the net number of opportunities created remains on par with the team as the poor conversion rate was masked by the high volume of leads.
This may be an indication of a performance or training challenge with these sales reps, or it could be that the volume of leads was so high that they were unable to truly dedicate sufficient effort to each lead.

Looking at a Difficult Problem
How are you analyzing and optimizing your handoff process from marketing to sales? Just delivering leads is not enough, if you’re not able to ensure quantity, quality, and follow-up, you may be leaving money on the table.


