 Companies rely on statistical analysis to extract information from their Customer experience management (CEM) data. Companies use statistical analyses to extract different types of information from their data. For example, segmentation analysis (using analysis of variance) is used to understand differences across key customer groups. Driver analysis (using correlational analysis) is conducted to help identify the business areas responsible for customer dis/loyalty. These types of analyses are so commonplace that some Enterprise Feedback Management (EFM) vendors include these sorts of analyses in their automated online reporting tools. While these analyses provide good insight, there is still much more you can learn about your customers as well as your CEM program with a different look at your data. We will take a look at reliability analysis.
Reliability Analysis
To understand reliability analysis, you need to need to look at your customer feedback data through the eyes of a psychometrician, a professional who practices psychometrics. Psychometrics is the science of educational and psychological measurement and is primarily concerned with the development and validation of measurement instruments like questionnaires. Psychometricians apply scientifically accepted standards when developing/evaluating their questionnaires (please see Standards for Educational and Psychological Testing). One important area of focus for psychometricians relates to reliability.
Reliability
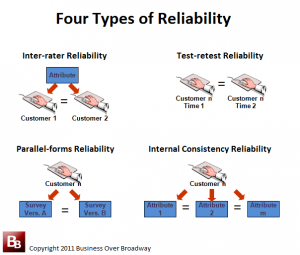
Reliability refers to the consistency/precision of a set of measurements. There are four different types of reliability: 1) inter-rater reliability, 2) test-retest reliability, 3) parallel-forms reliability and 4) internal consistency reliability. Each type of reliability is focused on a different type of consistency/precision of measurement. Each type of reliability is indexed on a 0 (no reliability) to 1.0 (perfect reliability) scale. The higher the reliability index (closer to 1.0) , the greater the consistency/precision in measurement.
Inter-rater Reliability
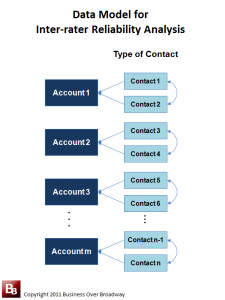
Inter-rater reliability reflects the extent to which Contacts within an Account give similar ratings. Typically applied in a B2B setting, inter-rater reliability is indexed by a correlation coefficient between different Contacts within each Account across all Accounts (see Figure 1 for the data model to conduct this analysis). We do expect the ratings from different Contacts from the same Account to be somewhat similar; they are from the same Account after all.
A low inter-rater reliability could reflect a poor implementation of the CEM program across different Contacts within a given Account. However, a low inter-rater reliability is not necessarily a bad outcome; a low inter-rater reliability could simply indicate: 1) little or no communication between Contacts within a given Account, 2) different Contacts (Business-focus vs. IT-focus) have different expectations regarding your company/brand or 3) different Contacts have different experiences with your company/brand.
Test-retest Reliability
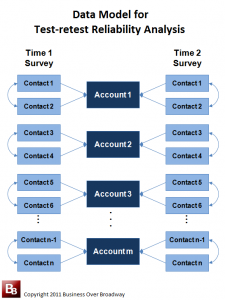
Test-retest reliability reflects the extent to which customers give similar ratings over a non-trivial time period. Test-retest reliability is typically indexed by a correlation coefficient between the same raters (customers) across two different time periods (See Figure 2 for the data model to conduct this analysis). This reliability index is used as a measure of how stable customers’ attitudes are over time. In my experience analyzing customer relationship surveys, I have found that customers’ attitudes tend to be somewhat stable over time. That is, customers who are satisfied at Time 1 tend to be satisfied at Time 2; customers who are dissatisfied at Time 1 tend to be dissatisfied at Time 2.
A high test-retest reliability could be a function of the dispositional tendency of your customers. Research finds that some people are just more negative than others (see negative affectivity). This negative-dispositional tendency impacts all aspects of these people’s lives. Some customers are just positive people and will tend to rate things positively (including survey questions); others, who are more negative, will tend to rate things negatively. However, a high test-retest reliability could indicate that customers are simply receiving the same customer experience over time. A low test-retest reliability could reflect an inconsistent service delivery process over time.
Parallel-forms Reliability
Parallel-forms reliability reflects the extent to which customers give similar ratings across two different measures that assess the same thing. For practical reasons, this form of reliability is not typically examined for CEM programs as companies have only one customer survey they administer to a particular customer. Parallel-forms reliability is typically indexed by a correlation coefficient between the same raters (customers) completing two different measures (given at the same time).
Internal Consistency Reliability
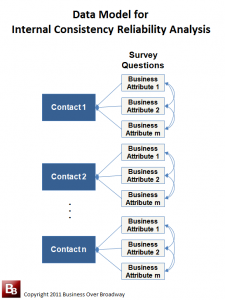
Internal consistency reliability reflects the extent to which customers are consistent in their ratings over different questions. This type of reliability is used when examining a composite score that is made up of several questions. This type of reliability tells us if each question that makes up the composite score measures the same thing. Internal consistency reliability is typically indexed by Cronbach’s alpha.
We expect a relatively high degree of internal consistency reliability for our composite scores (above .80 is a good standard). A low internal consistency reliability indicates that our composite score is likely made up of items that should not be combined together. We always strive to have a high internal consistency reliability for our composite customer metrics. Customer metrics with high internal consistency reliability are better at distinguishing people on the continuum of whatever it is you are measuring (e.g., customer loyalty, customer satisfaction). When a relationship between two variables (say, customer experience and customer loyalty) exists in our population of customers, we are more likely to find a statistically significant result using reliable customer metrics compared to unreliable customer metrics.
Applications of Reliability Analysis
Companies conduct reliability analysis on their CEM-generated data for several reasons. These include:
- Validate the customer feedback process: When CEM data are used for important business decision (e.g., resource allocation, incentive compensation), you need to demonstrate that the data reflect real customer perceptions about important areas.
- Improve account management: Reliability analysis can help you understand the extent of agreement between different Contacts within the same Account. Your account management strategy will likely be different depending on the agreement between Contacts within Accounts. Should each relationship be managed separately? Should you approach the Accounts with a strong business or IT focus?
- Create/Evaluate customer metrics: Oftentimes, companies use composite scores (average over several questions) as a key customer metric. Reliability analysis will help you understand which questions can/should be combined together for your customer metric.
- Modify surveys: Reliability analysis can help you identify which survey questions can be removed without loss of information; Additionally, reliability can help you group questions together that make the survey more meaningful to the respondent.
- Test popular theories: Reliability analysis has helped me show that the likelihood to recommend question (NPS) measures the same thing as overall satisfaction and likelihood to buy again. – see True Test of Loyalty. That is why the NPS is not better than overall satisfaction or continue to buy in predicting business growth.
- Evaluate newly introduced concepts into the field: One of my biggest pet peeves in the CEM space is the introduction of new metrics/measures without any critical thinking behind the metric and what it really measures. For example, I have looked into the measurement of customer engagement via surveys and found that these measures literally have the exact same questions as our traditional measures of customer loyalty (e.g., recommend, buy again, overall satisfaction (please see Gallup’s Customer Engagement Overview Brochure for an example). Simply giving a different name to a set of questions does not make it a new variable. In fact, Gallup says nothing about the reliability of their Customer Engagement instrument.
Summary
Establishing the quality of CEM data requires specialized statistical analysis. Reliability reflects the degree to which your CEM program generates consistent results. Assessing different types of reliability provide different types of insight about the quality of your CEM program. Inter-rater reliability indicates whether different Contacts within Accounts give similar feedback. Test-retest reliability indicates whether customers (Contacts) give similar ratings over time. Internal consistency reliability indicates whether your aggregated score (averaged over different questions) makes statistical sense. Assessing the reliability of the data generated from your CEM program needs to be an essential part of your program to ensure your program delivers reliable information to help senior executives make better, customer-centric business decisions.


