

Your Customer Experience ROI Handbook started with “What is CX ROI?” (return on investment) and continues here with “Proving CX Value” in chapter two of this five-part series. To recap:
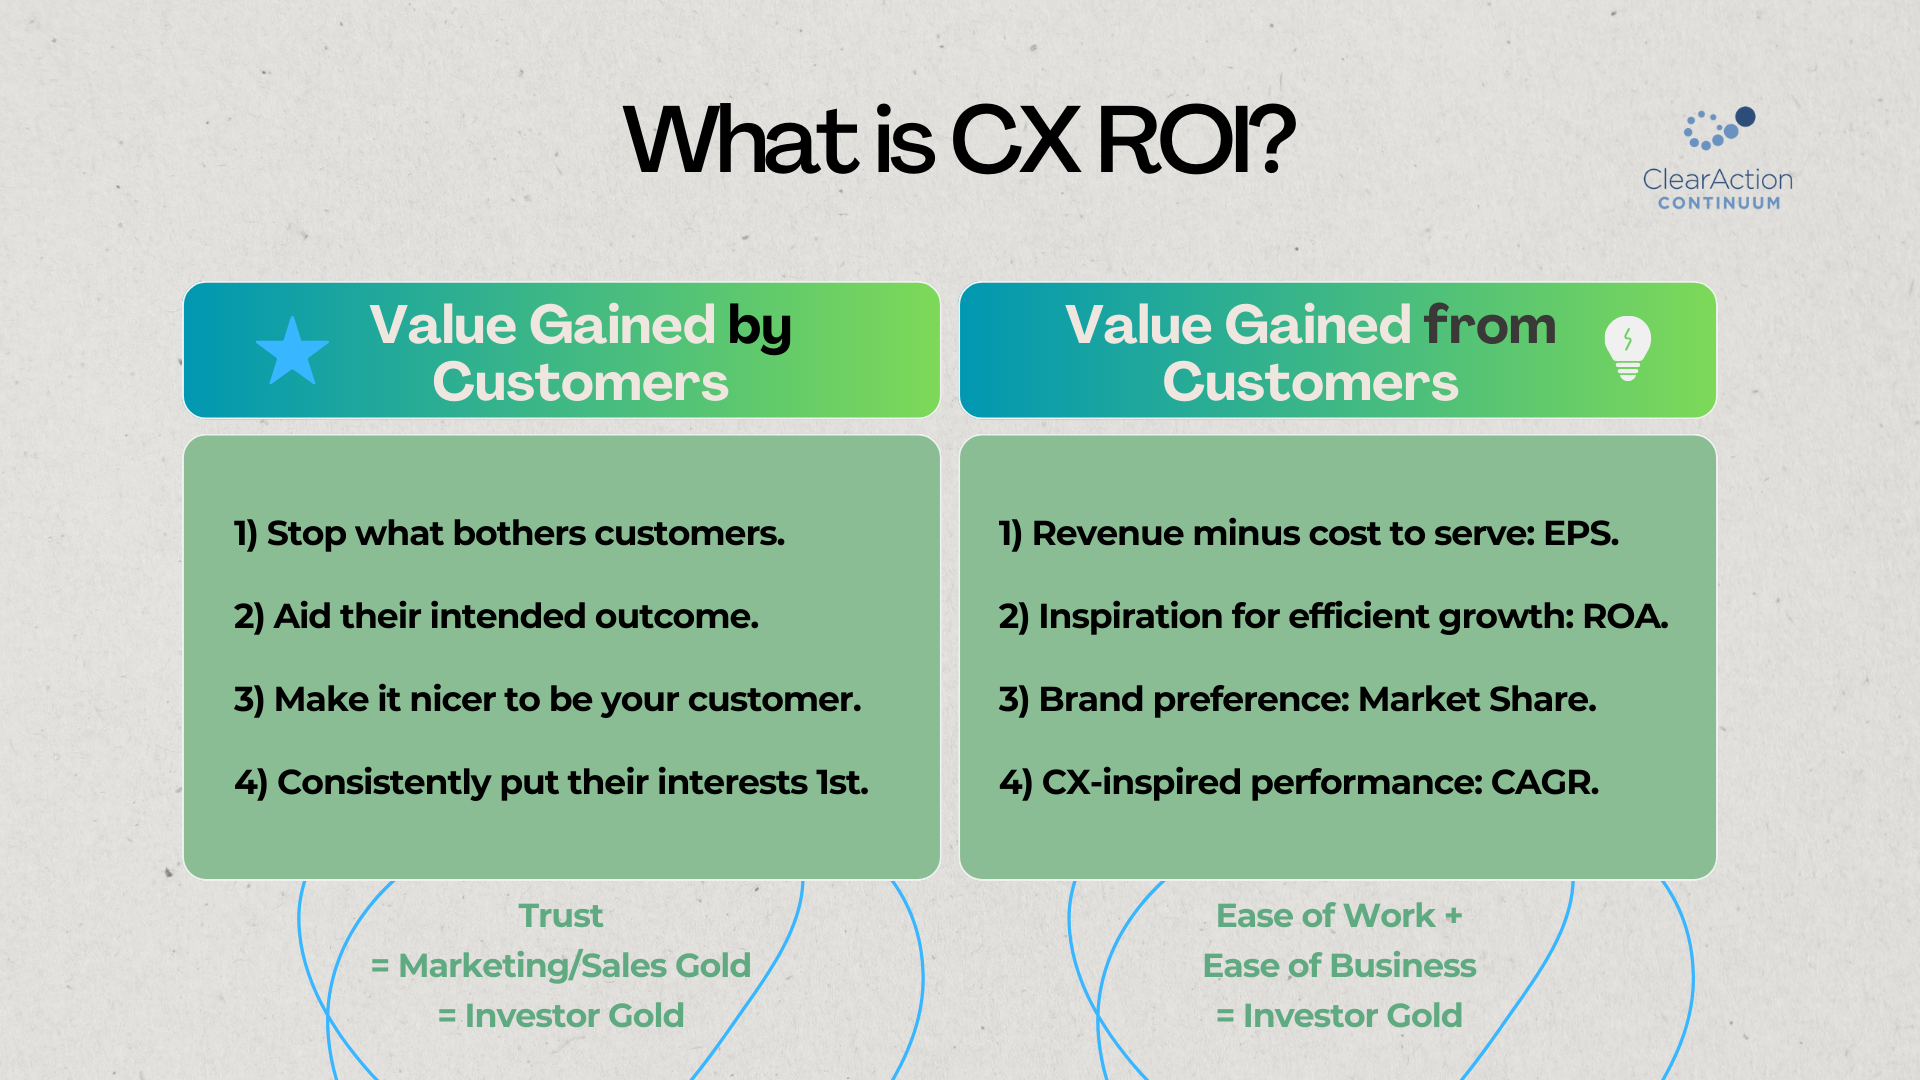
Customer Experience ROI is value gained by customers plus value gained from customers.
“Value gained” means a change happened:
— “After” is better than “before”.
— More money, time, energy, or opportunities.
— Less cost, delay, stress, or squandered potential.
Therefore, if your CX work is collecting or analyzing or diagramming or fire-fighting or doing something — without making the current situation better than before (as listed above) — then your customer experience ROI is low.
Contents
1. Value of customers’ time reduced in waiting, repetition, etc.
2. Sales cycle to overcome doubts.
3. Value of trouble-shooters for the issue resolved.
4. Value of trouble-shooters redeployed to value-creators.
5. Cost savings of reduced emails and meetings to correct snafus.
6. Value of stopping rework and redundancies.
7. Employee retention.
8. Productivity increases when jobs have less negativity.
9. Remedial costs to serve this issue.
10. Revenue gained by avoiding inflation and shrinkflation.
11. Value of customers’ increased productivity in their life or business.
12. Value of process or policy change for ease of business.
13. Value of proactive expectations management.
14. Value of customer-first invitations, engagement, and messaging.
15. Purchase behaviors after a CX intervention.
16. Purchase behaviors after a CX innovation.
17. Value of customer-centered management and design.
18 Value of recommendations.
19. Value of preferred brand.
20. Value of wallet expansion.
21. Value of CX-inspired efficiencies.
22. Value of CX-inspired performance.
3 Myths of Proving Customer Experience ROI
3 myths cause low customer experience ROI: quick wins, partial data, and control.
Myth 1: Short-term vs. long-term value gained:
— True: Quick wins are short-term value.
Marketing, Sales, and Customer Success already drive near-term value.
Customer behavior change is a continual treadmill of effort.
Incentives shape discount-seeking vs. relationship strength.
Quick wins are erased as root causes re-emerge.
— True: Root cause resolution is permanent value.
Customer Experience leaders aim for permanent value.
Internal change of root causes is long-term value.
9700% CX ROI within a few months is possible.
It benefits all current and future customers.
It improves ease of work and ease of business.
It increases magnetic acquisition and retention.
Myth 2: Complete data vs. partial data:
— True: Executive decisions are based on relative size of risks.
Show the greater risk from route 1 vs. route 2.
Nobody cares about the pennies. Make logical estimates.
1 fact may be enough to show the greater risk.
Start with what you know. Say it’s the tip of the iceberg.
For every CX finding, connect 1 or more known costs or gains.
Myth 3: Controlling value vs. influencing value:
— True: Customer experience ROI goes beyond what you personally do:
Customers experience your company as a whole.
Everyone contributes to more value or less value.
The people affecting value do not need to report to you.
Customer experience ROI is greatest when you influence
all general managers and functional areas to
minimize less value and maximize more value.
Proving CX Value Gained by Customers
1) Stop the root causes of things that bother customers.
— Value of customers’ time reduced in waiting, repetition, etc.
Estimate hourly pay of your customers
Multiply pay by time saved
This is gold in Marketing and Sales messages
Best way to increase VoC response rates
— Value of customers’ consequences from this issue.
What do they regain that they lost due to this issue?
(they’ve told you in conversations: Support, Success, Sales, social media)
This is gold for relationship strength and retention
— Sales cycle to overcome doubts.
Number of deals requesting additional proof points
Days delayed for sales closure
[Opportunities x price x win rate] / days = sales velocity
— Value of trouble-shooters for the issue resolved.
Estimate hourly pay of trouble-shooters
Multiply pay by time per week on this issue
Multiply by 52 weeks and number of trouble-shooters
— Value of trouble-shooters redeployed to value-creators.
Estimate value of their new achievements
— Cost savings of reduced emails and meetings to correct snafus.
Estimate hourly pay of all involved
Estimate time reading, research, responding to email in 1 week
Estimate time in issue resolution meetings in 1 week
Add all this and multiply by 52 weeks
— Value of stopping rework and redundancies.
Ask staff what had to be redone in the past quarter
Ask what was redundant (repetitive, duplicative)
Ask how many hours were tied up with the above, plus spending
Multiply by estimated hourly pay and by 4 quarters, plus spending
— Employee retention.
(vs. churn from stress burnout in handling this issue)
Cost of exiting an employee
Plus cost of acquiring replacement employee
Plus cost of their ramp-up to competency
Multiply by employees churned due to the issue
— Productivity increases when jobs have less negativity.
Identify similar workers who didn’t handle this issue
Compare their work volume to those who did handle it
— Remedial costs to serve this issue.
Remedies provided for customer complaints
Return handling costs for this issue
Refunds issued for this issue
Escalations: hourly pay of all involved
Churn caused by this issue
Longer sales cycle due to customers’ doubts
Add any or all of these costs
Note: These are costs of poor experience
This sum applies to all future years!
— Revenue gained by avoiding inflation or shrinkflation.
Market share gained vs. competitors who reduced value
Revenue of that market share gain
2) Help customers achieve their intended ultimate outcome.
— Value of customers’ increased productivity in their life or business.
What are they doing via your brand?
Have you made that faster or easier?
Have you made it more efficient or effective?
Mine their voice (Support, Sales, Success, social)
Ask them to verify your estimate of value you added
This is gold for Marketing and Sales messages
3) Making it nicer to be your customer: more trust, more ease.
— Value of process or policy change for ease of business.
How does it affect customers’ time, resources, opportunities?
Mine their voice (Support, Sales, Success, social)
Mine your databases (CRM, ERP, etc.) for incident reports
Show savings for them and for you
Track upticks: trust, retention, sales cycle, and acquisition
— Value of proactive expectations management.
How does it affect customers’ time, resources, opportunities?
Mine their voice and your databases for their savings
How does it prevent costs for you?
Avoiding Support inquiries and remedies
Avoiding returns, refunds, and escalations
Avoiding negative word-of-mouth: sales cycle length
Avoiding Marketing & Sales budget to make up for churn
4) Be consistent in putting their interests first.
— Value of customer-first invitations, engagement, and messaging.
Audit what customers received this past quarter.
Advice/help toward their life or business goals is most valuable
For each: who benefits most — customers or your brand?
Compare brand-first vs. customer-first results
in retention and expanded purchases primarily
in conversions, cycle time, Support inquiries, etc. secondarily
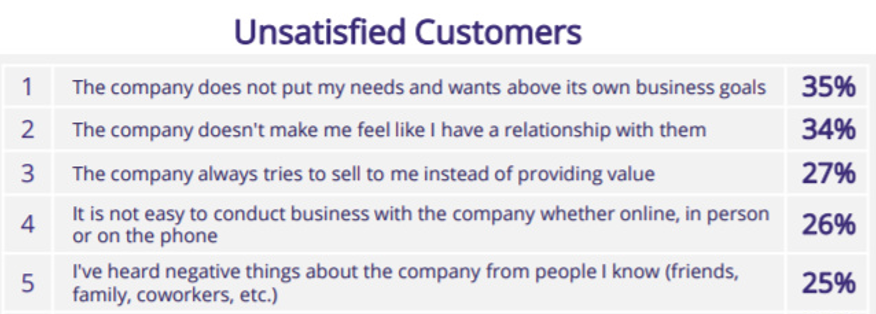
Source: MarketingSherpa
Proving CX Value Gained from Customers
1) Revenue minus cost to serve.
Note: Operating margin is a more accurate value indicator vs. revenue alone.
Otherwise, revenue may be pursued at high cost for the short-term, and even higher cost for the long term.
— Purchase behaviors after a CX intervention.
Who was momentarily upset but bought again? (same product or cross-selling)
Sum of their buying
Note: avoid selling during an “upset mood” transaction
Note: These are Support metrics
— Purchase behaviors after a CX innovation.
Who bought more to gain this?
Who switched from competitors to gain this
Sum of their buying
2) Inspiration for innovation, differentiation, and continuity.
— Value of customer-centered management and design.
What was shaped by customer trends/comments?
Ask Engineering, IT, Operations, etc.
— how it saved time, energy, and resources
— how it generated more time, energy, resources
Ask Sales how the above increased their productivity
Ask Audit and Strategy how the above reduced risk
3) Brand preference, share of wallet, positive word-of-mouth.
— Value of recommendations.
Which customers recommended you?
Revenue from their continued buying
Revenue from their recommendations
— referred customers: high vs. low volume purchases
— referred customers: high vs. low margin purchases
Market share gained
— Value of preferred brand.
Which customers expanded buying vs. last year?
Revenue this year minus revenue last year
Margin this year minus margin last year
(price elasticity, upselling, lower cost to serve)
Which customers recommend only your brand?
Revenue from their recommendations
— Value of share of wallet expansion.
Market share gained: revenue gained
Cost savings as sole supplier
Note: All the above are Marketing metrics.
4) Budget expansion via CX-inspired efficiencies and performance.
— Value of CX-inspired efficiencies.
(cost management in-tune with customer preferences)
Everything listed under “Stop Root Causes” above
How did increased salary, profit sharing, hiring,
and/or resourcing generate new growth?
— Value of CX-inspired performance.
(performance management in-tune with customer preferences)
Compare costs of poor experience contributed by:
— new products with vs. without HCD (human-centered design)
— new markets with vs. without HCD
— new business models with vs. without HCD
— departments with vs. without CX-informed performance standards
Proving CX Value to Financial Growth
Claim credit for all contributions toward revenue and costs, even if these contributions cannot yet be quantified. It’s still value. Talk about it as a contributor to your stakeholder’s goals.
— Operating Margin Ratio is contributed to by reducing costs of poor experience.
— Current Ratio is contributed to by strengthening customer relationships.
— Return on Assets is contributed to by increasing relationship duration.
— Cumulative Average Growth Rate is contributed to by increasing profitable revenue.
— Maximum investor value = customer lifetime value = all of the above combined.
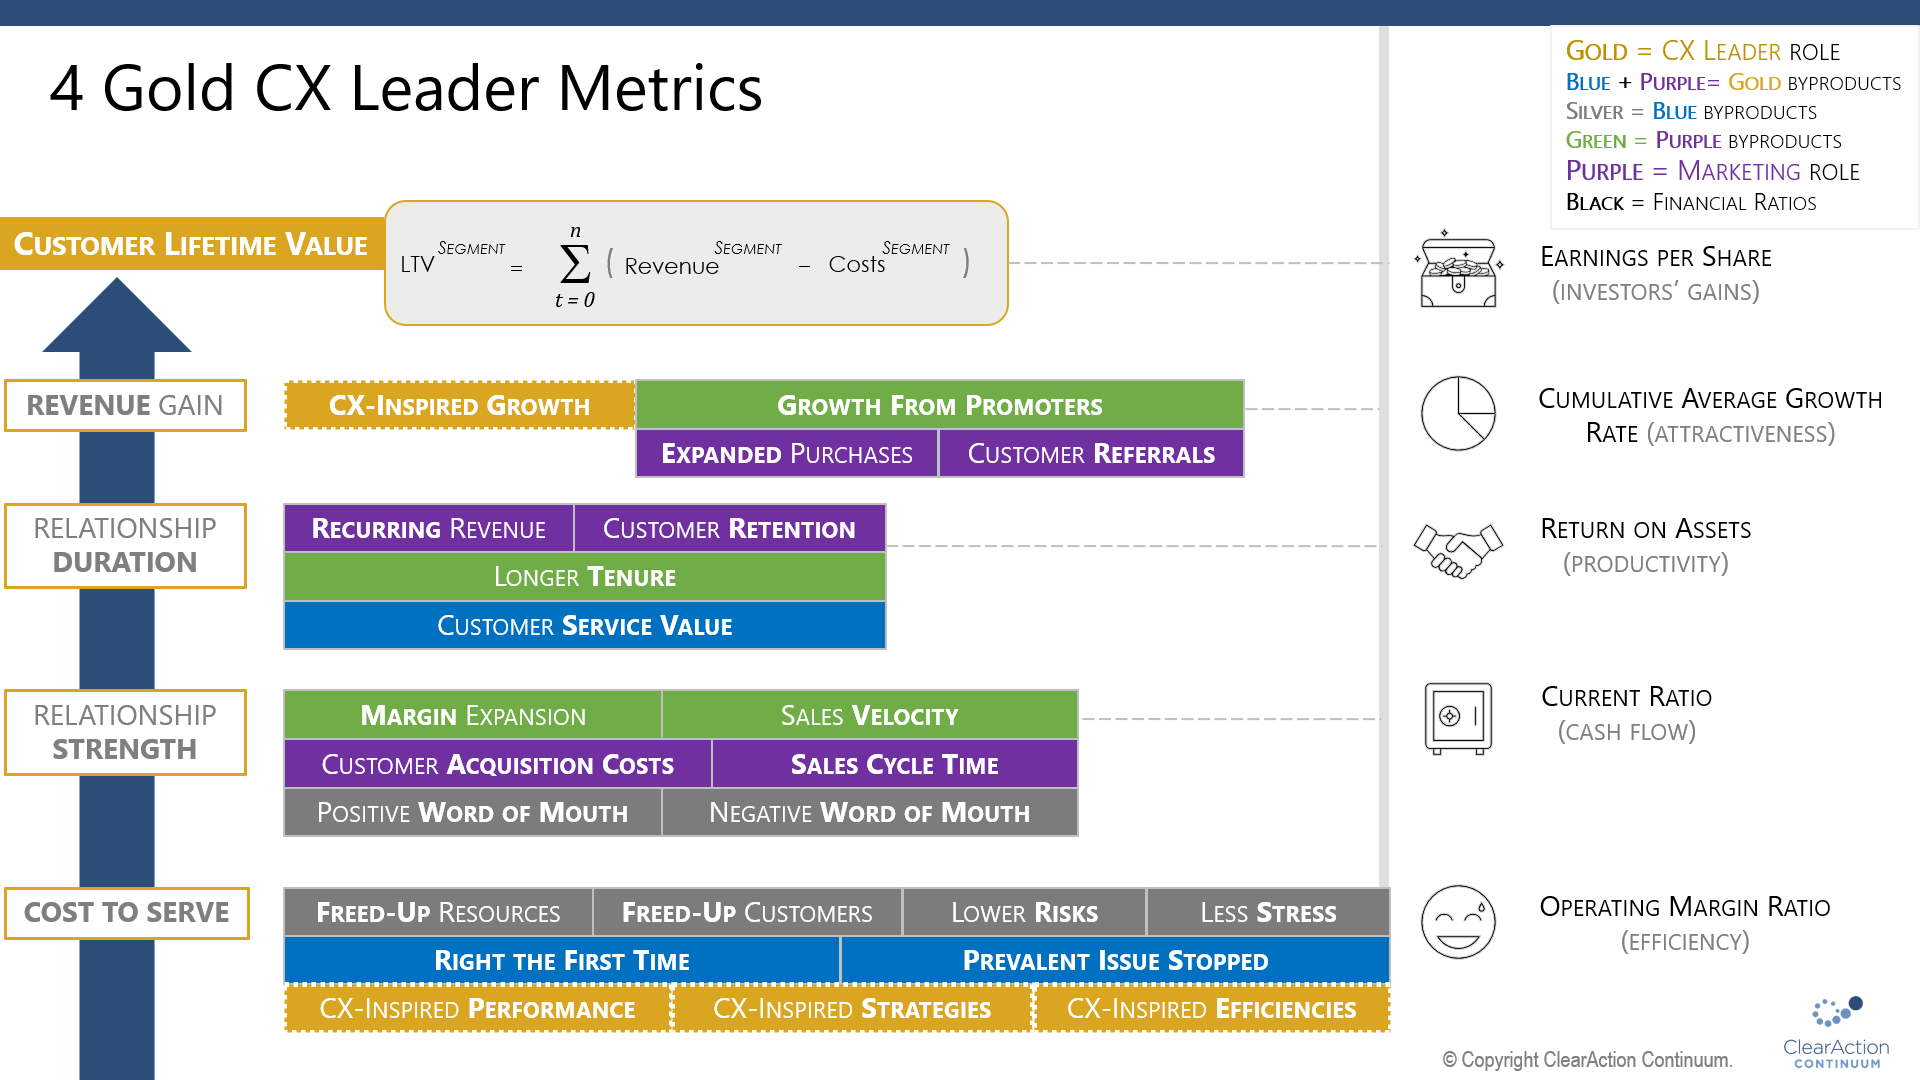
Simplify your CX Leader role by focusing on the 4 gold CX ROI metrics:
1. CX-Inspired Growth
2. CX-Inspired Performance
3. CX-Inspired Efficiencies
4. CX-Inspired Strategies
Why is value gained by customers valuable to you?
— They pay for salaries, budgets, and profits.
Investors expect customers’ buying to grow.
— Static value reduces your brand preference.
Declining value allows competitors to win.
Their prosperity is your prosperity:
empower them to empower you.
Thus, to maximize customer lifetime value, then focus first on value gained by customers.
Use CX insights to prioritize work, guide cost containment, and make wiser decisions of all kinds.
Understand clearly what customers are aiming for, and what they view as right-the-first-time, from pre-purchase onward.
Then, drive right-the-first-time performance across the end-to-end customer journey: no gaps is your goal.
Gap-free customer experience is the highest value possible.
For definitions of each metric shown in the diagram above, see:
24 CX ROI Metrics for Your Chief Customer Officer Prosperity Playbook.
For guidance in driving the 4 gold CX ROI metrics, see:
How 4 CX Metrics Drive 20 Growth Metrics
For guidance in driving the utilization of CX insights, see:
What’s Your Insights Utilization Rate? 24 Ways to Boost 2024 CX ROI
and Insights Usage Rate Drives Growth Through Customer-Centric Organizations
This article is the second in a five-part series:
1. Customer Experience ROI Handbook: What is CX ROI?
2. CX ROI Handbook: Proving CX Value to Executives
3. CX ROI Handbook: Connecting Employee Experience and Customer Experience ROI
4. CX ROI Handbook: Business Outcomes and Customer Outcomes
5. CX ROI Handbook: CX Dashboards and Compensation
Images licensed to ClearAction Continuum by Shutterstock.


