
 B2B customer experience metrics maturity is about embedding automatic CX excellence as a way of life in your company. In human maturity, the ability to rise to any occasion and to toggle seamlessly to what’s most appropriate in any situation is deemed ideal. What customer experience metrics can empower your company to live this way?
NPS® and customer effort scores may be the most popular B2B CX metrics today, along with customer health scores, churn rate, and customer acquisition cost.
- Net Promoter Score® tends to take on a life of its own, with engagement efforts specific to Promoters, Passives, and Detractors — but does this approach address the multiple parties within each account who have a say in B2B purchases? Does it drive CX excellence as a way of life in your company?
- Customer Effort Scores often measure only the difficulty of getting help through customer care. Recently, B2B companies have been applying customer effort scores across the end-to-end customer journey. This is intended to simplify every interaction and touch-point, from customers’ perspectives — but does this approach address buying decision influencers in your customers’ companies who don’t interact with your brand? Does it reflect customers’ behind-the-scenes journey steps that aren’t touch-points?
- Churn Rate measures how many customers are deciding to buy elsewhere — does this approach help you prevent defections? Does it help your company toggle seamlessly to the most appropriate actions?
- Customer Acquisition Costs, Conversion Rates (and other measures of marketing and sales effectiveness and efficiency) gauge the pre-purchase customer journey phase — but do these approaches tell you anything about making CX excellence automatic during the (hopefully very long) post-purchase phase?
Take any B2B customer experience metric and apply the same scrutiny to see how well it’s meeting the maturity mark. In most cases, you’ll conclude that popular B2B customer experience metrics are necessary, yet insufficient.
Don’t be misled to think that you have to spend a certain amount of time in an immature state before graduating to maturity. In human development, setting behavior standards at an early age prevents a lot of heartaches, develops a more well-rounded individual, and contributes to the greater good. The same holds for customer experience maturity: aim now for the stars. Your company will be on a better path in many ways by doing so.
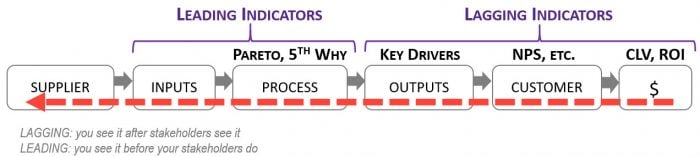
For B2B customer experience metrics maturity, you need to (A) monitor the realities of B2B CX and (B) link your metrics according to the natural chain reaction across your internal supplier-to-revenue performance spectrum.
B2B CX Metrics Realities
1) In B2B, multiple parties within the customer company play a role in purchase decisions, and accordingly, whose expectations need to be monitored.
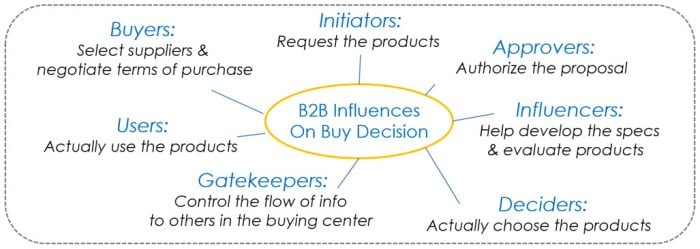
Be sure to capture feedback from all parties in ways that are natural to them — don’t try to force them to wade through questions or formats they would deem as irrelevant to their interests. For example, what’s germane to a purchasing manager is typically quite different from the concerns of a safety manager or an end-user.
Use stratified random sampling in your monitoring research for statistical confidence that each buying influencer group’s data is representative. This minimizes burnout and costs while allowing you to extrapolate findings to your whole customer base.
Expectations research is different from typical ongoing VoC. Expectations are usually captured through comments. There are many ways customers initiate comments to your company: your website, industry communities/websites, symposiums, trade shows, your contact center, and customer success teams, and informal conversations with your employees and partners. Otherwise, you can prompt customer comments through an array of qualitative research, such as executive listening sessions, in-depth interviews, focus groups, user groups, or customer advisory boards.
Customer expectations clarity is vital to running your business effectively and efficiently. Your non-customer-facing groups need this clarity as much as anyone because their missteps have a snowball effect in remedial costs, reputation tarnishing, and lost opportunities.
Monitoring research is typical VoC, checking-in with customers during or after transactions, in relationship surveys, and other primarily quantitative studies. More modern approaches allow customers to give you feedback anytime, anywhere, and any way. For example, you can add a link or QR code to your products, correspondence, signs, digital touch-points, and so on. Monitoring research reveals customers’ realities (their perceptions) relative to their expectations.
As the diagram below instructs, you’ll want to use your expectations research to educate all facets of your business in their performance standards. This is how customer-centricity is built. And it’s how massive waste is avoided.
By following this diagram, your monitoring research can be reduced massively. Natural byproducts of this diagram’s formula are churn reduction, up-selling, cross-selling, referrals, and acquisition cost reduction.
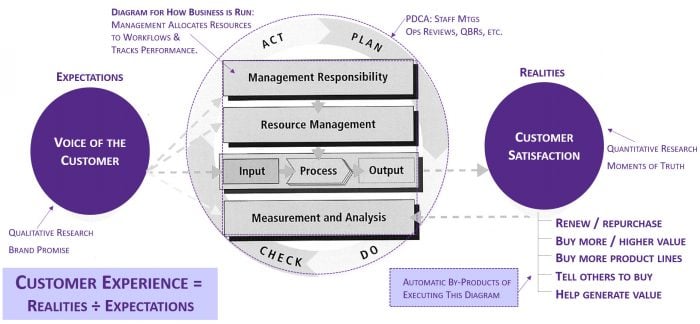
Ultimately, customers’ realities must match their expectations, or else they will quit buying. Therefore, it’s sensible to track this equation as a primary management metric.
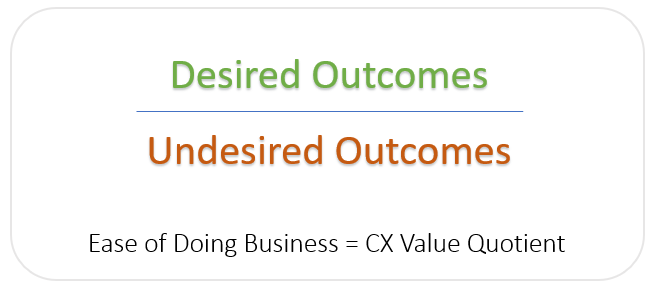
You’ll want customers’ realities versus expectations to be a ratio of 1:1 or higher. This ratio is called the Customer Experience Value Quotient1. It’s a measure of Ease-of-Doing-Business.
The CX Value Quotient can be summarized by account and by each B2B buying decision influencer’s role across accounts. It can be summarized by location and by each of your solutions. It can also be summarized by each phase of the customer journey.
The CX Value Quotient is superior to Customer Effort Score because is goes beyond interactions.
- The denominator represents your brand promise or your value proposition or contract — what customers expect.
- The numerator is penalized by every deviation from what was promised or expected. For example, each time a customer must contact you with complaints or questions which your company could have prevented, that’s a value demerit. For instances where they contact your company about their own changes or mistakes, there’s no demerit unless the customer effort to do so (or the post-contact aftermath of waiting or worry) was inordinate.
- The numerator grows by every instance of value customers receive beyond what was promised or expected. However, this increase is less than a 1:1 replacement for demerits, to accurately reflect human nature in disappointment and forgiveness.
Emphasis on the CX Value Quotient teaches all managers that embedding automatic CX excellence as a way of life in your company is their goal.
2) For B2B purchases, relationships are vital and sales cycles may stretch across weeks or months.
Customer Lifetime Value2 reflects and nurtures this longer horizon. It’s the cumulative revenue minus the cumulative costs of serving a customer account or a customer segment, across the duration of their expected relationship with your brand.
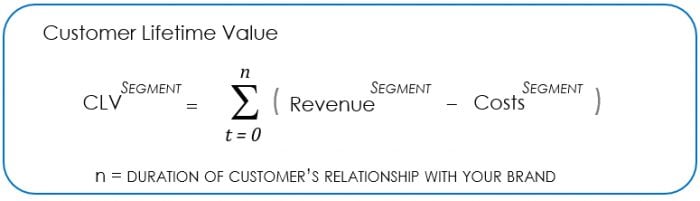
Customer Lifetime Value is similar to the CX Value Quotient in the sense that they both reward value increases and they both penalize waste. Customer Lifetime Value differs in reflecting your company’s interests (revenue and costs to serve) whereas CX Value Quotient reflects customers’ interests (the integrity of your promises). Customer Lifetime Value quantifies the CX Value Quotient in managers’ language: money.
Most managers are hesitant to use Customer Lifetime Value because it’s difficult to track all revenue and even harder to track all costs. It’s tough to estimate relationship length and it’s challenging to divvy up fixed costs per customer account or customer segment.
Nonetheless, any informal use of Customer Lifetime Value is helpful. ClearAction’s 5-year global study of customer experience management practices revealed significant advantages from expressing customers’ sentiment and/or behaviors in terms of revenue and/or cost. As such, whenever you know an element of cost or an element of revenue associated with an account or a segment, use it. Be sure to state the parameters of your figures.
Directional correctness is typically all that’s needed to put insights into action on the right things. Quantifying in money terms compels managers to get serious about committing resources to the right actions.
Customer Lifetime Value is a customer experience metric that motivates managers to embed automatic CX excellence as a way of life in your company.
3) After purchase, B2B customers typically interface with suppliers significantly — and the stakes are high — making post-purchase marketing and customer experience management just as important as the pre-purchase phase.
Key driver analysis from your monitoring research reveals which aspects of the customer experience have a strong statistical correlation to loyalty. Your performance on these key drivers — as evaluated by customers — often spells the difference between discontinuing or continuing their engagement with your brand. Accordingly, key drivers are typically called “Moments of Truth”.
Where you’ll see the greatest rewards from your customer experience efforts is in acting on the right things associated with the key drivers. When I led customer experience company-wide at Applied Materials, my team regularly provided more than 50 lines of business and account teams with their own VoC report, showing key drivers for our company overall and key drivers for their own cut of the VoC data.
Then we conducted a Pareto analysis to identify the vital few sub-themes of each key driver: the 80-20 rule says that 80% of the issue can be solved by 20% of the causes. By focusing on the root causes (5th why) of the vital few — rather than just the quick wins — we made impressive strides in preventing recurrence of customers’ biggest gripes.
Solving root causes of key drivers saved massive time, money, stress, and opportunities for both customers (marketing gold) and ourselves (profitability gold).
Root Cause Indicators are internally monitored progress metrics of solving root causes of key drivers. They are typically measures of responsiveness improvements, defect/bug reductions, knowledge transfer effectiveness, seamless handoffs, and similar operational elements that have a snowball effect on customers’ experiences.
We based bonuses and recognition on Root Cause Indicators. We knew that customers’ perceptions and buying behaviors would soon change in accordance with the trends we were seeing in our Root Cause Indicators.
Root Cause Indicators are B2B customer experience metrics that strengthen relationships across the post-purchase phase of the end-to-end customer journey and customer life cycle.
4) B2B interfaces between customer and supplier tend to be far-reaching beyond Customer Service.
Your B2B customer experience metrics dashboard needs to reflect the many aspects of the end-to-end customer journey.
Customer Service and Customer Success are certainly essential. They’re vital to “saving the day” with customers at high risk of churn. However, there will always be a percentage of customers with the same issues who do not participate in your customer feedback, customer care or customer success services. For more profitable business and better customer experience leadership, you’ll want to build in safeguards that prevent issues which otherwise require Service and Success help.
In addition to Service and Success metrics, your customer experience balanced scorecard should give high visibility to pre-purchase Marketing and Sales metrics as well as Root Cause Indicators, CX Value Quotients, and Customer Lifetime Value.
A transparent balanced scorecard of customer experience metrics gives management at every level a well-rounded view of the end-to-end customer experience.
5) Numerous parties inside the supplier company interact with their counterparts in the customer company, in many cases.
Your engineers may interface with your customers’ engineers. Likewise, your marketing managers may collaborate with your customers’ marketing managers in issuing a joint press release. There are numerous non-customer-facing roles in your company that touch customers informally. The casual comments made by customers during these interactions can be far more valuable than what’s captured in your monitoring surveys.
You can create an app or an online portal for your employees and partners to submit customers’ casual remarks and body language. You can set this up to protect customer privacy. The beauty of this real-time reporting is its power to inform relevant parties across your company of customers’ emerging needs or evolving expectations and decisions.
I was training a group of technical specialists who occasionally accompanied Sales managers on B2B customer visits. They told me that they heard a lot of important things during their customer interactions, but they waited for the customers to report those things in the formal survey that was invariably sent a while later. I told them there’s no reason to not pass along valuable insights as soon as possible. Timely action can put you ahead of your competition, save time and costs for a lot of people, and strengthen your customer relationship. Pooling these informal insights — and combining them with formal VoC — can help you see patterns that can be applied to Root Cause Improvements.
You can track the frequency of negative customer comments on a given topic (coming into your Customer Care group and your monitoring research) to see a steady decrease in the number of negative comments. But how will they decrease? (1) By gaining timely insights from ongoing informal comments about those specific topics and (2) by compelling root cause-based action among the parties responsible for that topic area’s performance.
Comment collection can make your company smarter about how to reduce complaints. Your B2B customer experience metrics portfolio should monitor reduction in negative comments as a ratio of all comments collected. This is an internal version of Word-of-Mouth Equity.
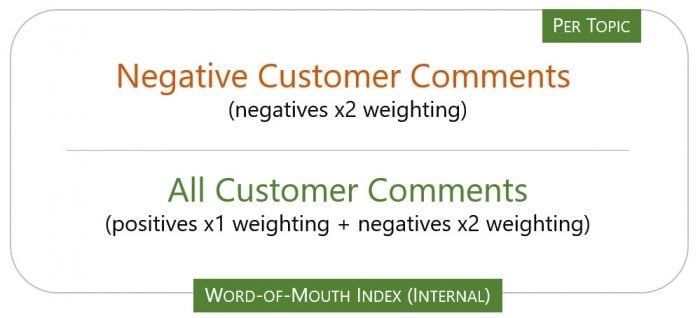
Word of Mouth Equity is typically measured by volume x impact.3 Impact is a weighting factor of each comment.
- Negative comments have double power versus positive comments. For any given topic, take the negative comments and multiply them by two.
- Positive comments are multiplied by one
- As you expand your collection of customer comments, the incidence of positive comments will increase, providing a larger denominator.
- As you make sustainable improvements by acting on the negative comments, the numerator and denominator will decrease.
- The lower the ratio of your internal version of the Word-of-Mouth Equity Index, the better your performance — the better your customers’ experience is becoming.
.
A study by McKinsey explained: “In the mobile-phone market, for example, we have observed that the pass-on rates for key positive and negative messages can increase a company’s market share by as much as 10% or reduce it by 20% over a two-year period, all other things being equal. This effect alone makes a case for more systematically investigating and managing word of mouth. . . . Word-of-mouth equity empowers companies by allowing them to understand word of mouth’s relative impact on brand and product performance. . . . And because it measures performance rather than the sheer volume of messages, it can be used to identify what’s driving and hurting word-of-mouth impact.”3
Word of Mouth Equity Index is a B2B customer experience metric that strengthens customer-centric culture by teaching managers to collect and address customer inputs and feedback.
6) The significance of the B2B solution’s performance, per se, cannot be underestimated.
Customer experience certainly goes beyond interactions. What is bought, itself, is of paramount importance to your B2B customers’ success.
- How well does it integrate with your B2B customers’ environment (hardware, software, processes, people, etc.)?
- How well does it address your B2B customers’ intended outcome (i.e. job-to-be-done or reason for “hiring” your solution)?
- How well does it respect the CX Value Quotient?
Assess the above questions for each major customer segment, to track the Solution Efficacy Index for each group:
1) Your core-growth customers: who you rely upon for the bulk of future revenue.
2) Your other customer segments.
3) Undershot customers: who need more sophistication to meet their intended outcomes.
4) Overshot customers: who need less sophistication (more accessible price or location(s), lite version, etc.).
Answers to these questions can create a Solution Efficacy Index. You can use any scale that makes the most sense for your customers’ need for specificity in evaluating these three questions.
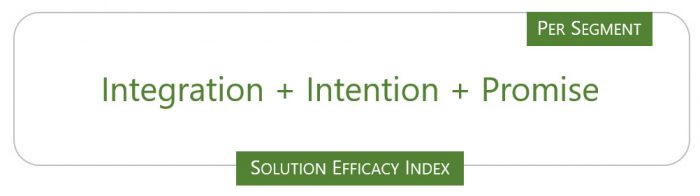
Your Solution Efficacy Index is a B2B customer experience metric that respects customers’ primary investment and encourages strong growth by continually improving your solution to satisfy a broader market and “own” your core-growth customers’ loyalty.
B2B CX Metrics Chain Reaction
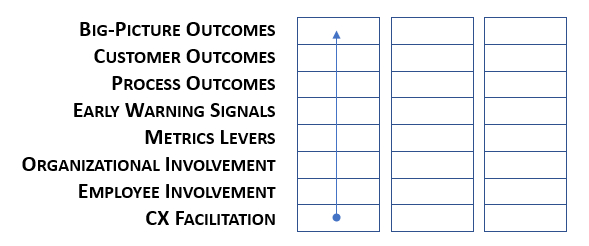
There is a chain reaction of performance between the direction you set with suppliers (and employees and partners) and their workflows and handoffs. How you set up this chain reaction has a direct bearing on the outcomes produced.
Customers experience the outcomes of your collective workflows. These experiences shape their sentiment and behavior, which in turn, shapes financials (revenue, costs, share of wallet, market share, etc.).
In the diagram below:
- Big picture outcomes represent financials. Customer outcomes are tracked by monitoring research (NPS®, etc.).
- Process outcomes are identified through Key Driver Analysis and then Pareto Analysis.
- Early Warning Signals are identified by 5-Why’s Analysis and monitored via Root Cause Indicators.
- Involvement and Facilitation represent how you setup suppliers, partners and employees to have quality inputs and to focus on the right things.
This diagram is specific to your customer experience team as the generator and facilitator of CX performance. You can substitute the “CX Facilitation” layer with any of your suppliers or partners who you rely upon for your workflows.
Make sure your balanced scorecard connects the dots across this supplier-to-revenue performance spectrum. Otherwise, you’ll end up spending tremendous amounts of money, time, and opportunities on remedial needs: the tail wags the dog.
When you show performance across this spectrum in your dashboard, you’re clarifying what drives what, to prevent mindsets that put the cart before the horse.
Systematize your B2B customer experience metrics by reviewing them at every opportunity: staff meetings, ops reviews, business reviews, recognition criteria, bonus criteria, advancement criteria, and so forth. Bring high visibility to your CX Value Quotient, Customer Lifetime Value, Root Cause Indicators, end-to-end customer journey metrics, Word-of-Mouth Index, and Solution Efficacy Index.
B2B customer experience metrics maturity establishes your company’s ability to rise to any occasion and to toggle seamlessly to what’s most appropriate in any situation. These indicators embed automatic CX excellence as a way of life in your company.
Notes:
1. Ease of Doing Business: Best Leading Indicator of Growth
2. Customer Experience Indexes: Modern Thinking
3. A New Way to Measure Word-of-Mouth Marketing
This article is the second in a year-long CustomerThink Advisors series on B2B Customer Experience Maturity
- 10 B2B Customer Experience Myths & How to Improve Your CX Maturity
- B2B CX Metrics & ROI Maturity: Linking Customer Expectations to Business Performance
- B2B Customer Experience Governance Maturity
- B2B Voice of Customer Maturity
- B2B Customer Experience Leadership Maturity
Image licensed to ClearAction Continuum by Shutterstock.


Great article, Lynn! Appreciate this very in-depth discussion about B2B CX Metrics.
I was struck by this observation:
“there will always be a percentage of customers with the same issues who do not participate in your customer feedback, customer care or customer success services. For more profitable business and better customer experience leadership, you’ll want to build in safeguards that prevent issues which otherwise require Service and Success help.”
In Beyond the Arc’s work in customer journey analytics, we’ve found that as few as a dozen or two comments might represent hundreds or thousands of customers who are having the same issue, but just not reporting it.
Wow, that’s an amazing finding, Steven. Thanks for your comment.
Just today I was forced to call a vendor several times in order to get through to an agent who could help me. The problem was caused by a printer failure on my end, which froze my computer and required rebooting. When I went back into the software I was using, I was unable to move forward in its sequence because the data associated with the step I was trying to document by printing was now lost. I had a receipt for that step, but the order number on the receipt was insufficient for the software to move forward; they required me to call their customer service for resolution.
When I first called, it was 5 minutes before the end of their workday; the automated agent sequence took 6 minutes for me to spell my name, etc. and then it said it’s after hours. Today when I called again, the automated agent asked for several numbers and names, then sent me a text message with generic help articles. Next time I called, it gave me a human agent who I couldn’t hear. Next time I called, the agent understood my problem and spoke clearly, but I had to wait 20 minutes for her colleagues to check my story and generate the special code needed by the software to move forward.
What a rigmarole! I’m sure this company is proud of its investment in automated service help and in its agents’ training. They asked questions along the way about where I bought the software and whether I was using a Mac/PC, etc.. But what they really should have done is (a) provide the necessary code in the in-situ purchase receipt in case I had to shut down my computer before proceeding and/or (b) allow me to give my in-situ purchase receipt order number to their automated agent (or even to the human agent), instead of it asking me a bunch of questions that certainly seemed inane given my exasperation.
Although I provided this advice to the agent, of course she was primarily interested in me giving her a rating, and I doubt management will ever pay attention to this snafu and the relatively easy fixes that could prevent a large number of customers in a similar situation from having to spend so much time on resolution, and of course, saving their own internal time on repeated calls like this. I didn’t want to call their service; I just wanted to see a way to move forward in the software using info on-hand, such as my receipt.
Time is money. You never get time back. Prevention of problems is what investors, employees and customers all want. CX strategy needs to migrate to a huge percentage of its attention on issue prevention, rather than service technology and resolution. Prevention is what our CX metrics should be gaging.
Hi Lynn,
Is there an acceptable rating/standard for Word of Mouth Equity Index?
Hi Paul, the acceptable standard for any metric typically depends on your customers’ expectation range. Some organizations’ customers have broader tolerances for performance, and this can vary by experience element.
For Word of Mouth Equity, this standard is more about your internal tolerance to negativity versus positivity in share of voice about your brand. This question may be best suited for your Brand Management leader, CMO, VP-Sales, CFO and CEO, who are all working so hard to boost positivity.
Thanks for your thoughtful question,
Lynn