
Reducing customer churn is a tall challenge for every company. Marketers are well aware that is far less expensive to retain a customer that is to acquire a new one1. Moreover, holding on to customers and creating a loyal base is the best way to ensure long-term sustained revenues and profitability. However, before the advent of customer contact analytics it is been very difficult to determine how to measure, predict, and control customer churn.
Let’s go through a four-step process to attack customer churn using contact optimization; speech and text analytics; AI, machine learning, and recommendations engines; and appropriate interventions by customer service agents, sales teams, and other customer-facing employees. These four steps are: (1) Measure customer churn at the reason code level; (2) Assign the appropriate action; (3) Predict what triggers churn; and (4) Change internal products, pricing, and processes to increase customer retention.
1. Measure customer churn at the reason code level.
Almost every company calculates customer churn using averages such as the percentage of customers that cancel a subscription or no longer purchase products or services divided by the entire customer base. Some approaches attempt to break down customer churn by customer types or personas, and while this is useful I have found that it’s far more powerful to measure customer churn at the reason code level. Let’s take a subscription service company whose average churn is 2.2% per month (~25% per year). When you analyze the churn rate for 86 customer contact reason codes, you get a wide range from 0.4% to more than 9.5% per month (>100% per year):

Let’s examine this in more detail. Using agent contact coding or, increasingly, speech analytics, companies can breakdown the wide range of customer contacts into discrete reason codes that are MECE (Mutually Exclusive and Collectively Exhaustive). We introduced this concept of reason code Collection reporting in our first book The Best Service is No Service2 based partly on my experiences as Amazon’s 1st WW VP of Customer Service 20 years ago; we are in the process of updating “Best Service” with new case studies, bad cases, and technologies. Using the customers’ language that is expressed in the first 30 seconds of a telephone call or the opening of an email or chat session produces excellent customer contact reason codes; for example, “Why is my bill so high?” or “I need to change my address” or “Where’s my stuff?”
If you trace the subsequent customer activities after each of these customer reasons using three time frames (15, 30, or 60 days) you can produce a composite metric for customer churn at the reason code level. Not surprisingly, innocuous reasons such as “I need to change my address” have a much lower propensity to churn while other frustrating reasons such as “My service keeps getting interrupted” lead to significantly higher customer churn. Then it becomes relatively simple to collect this customer churn data by reason code and report it weekly, monthly, and quarterly to observe trends using (a) total volumes of contacts; (b) total costs of those contacts (handling costs + “downstream costs”), and most importantly (c) costs per-customer or per-installation, or what we call CPX.
2. Assign the appropriate action.
As also introduced in The Best Service is No Service, it is important to assign an action to each of the customer contact recent codes based on using this 2 x 2 Value-Irritant matrix:
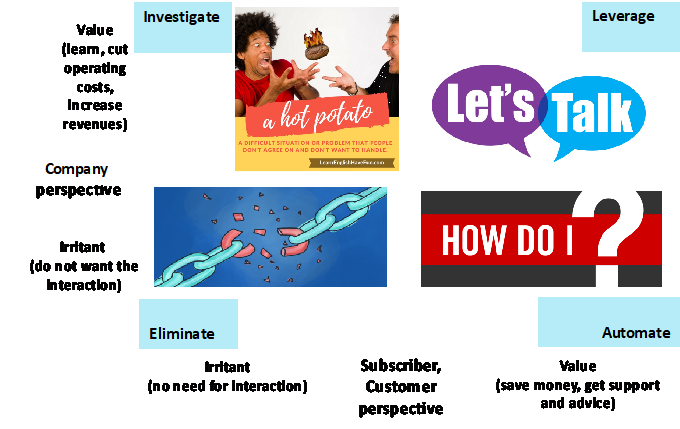
As a result, if you decide that the reason code is irritating for customers and also irritating (not wanted for live support) for your company, the appropriate action is to Eliminate that reason at its root. When the reason code is valuable for the customer but irritating for your company, the appropriate action is to Automate that reason with self-service solutions (chatbots, apps, portals, IVR, web-based tools) or with proactive alerts. That leaves relatively few customer contact reasons and their associated costs in the upper half of the matrix for customer contact reasons that are valuable (good for live support) for the company, with the action to Leverage (get more and spend more time on) those customer reasons that are valuable for customers as well or to Investigate reason codes that irritate customers (note that we use the hot potato for Investigate since ultimately the only valid action is to Eliminate it).
Using this Value-Irritant logic, it is clear that “Why is my bill so high?” requires either the action to Eliminate or Investigate; “I need to change my address” requires the action to automate; “Where’s my stuff?” and “My service keeps getting interrupted” both require the action to Eliminate. Examples of the Leverage action are “Tell me more about your new digital service” or “I want to cancel my account” (although some companies elect to Automate product or service cancelation). Customer churn for each of the customer reason codes assigned to Investigate or Eliminate have significantly higher churn, while those in Automate or Leverage have much lower churn. You can (and should) also associate with each customer reason code other KPI’s such as Customer Effort, FCR, or NPS; you’ll find a high correlation and causal connection between customer churn and high effort, low FCR, and low NPS.
3. Predict what triggers churn.
In step 3 you bring to bear BI, Big Data, and predictive analytics to determine what triggers customer churn3. By now you will know the gist of the customer contact reasons that produce high churn (e.g., “My service keeps getting interrupted”) but it’s essential to dig deeper through root cause analysis by analyzing speech patterns and emotional context from 10,000 customers that you have lost over the last 6 to 12 months. This will help produce a robust set of data to be able to determine why customers are upset or irritated with an issue and how to listen for those key words high levels of emotion in future conversations. For example, you may discover the customers are mentioning competitors by name or telling you that your company is much harder to deal with than others with which they have relationships (sometimes called “The Amazon Effect”) but which in our books we call “Last contact benchmarking”.
Emerging technologies will now enable you to listen real-time for these key words and emotional levels during inbound calls, email, or chat sessions, and use machine learning algorithms to produce immediate advice to the customer service agent, e.g., tell the agent to transfer the customer immediately to a level 3 escalation desk, propose a new personalized offer, provide other levels of concessions or discounts or refund, as well as slow down, listen more intently, apologize, and try to discern why the customer got into that situation.
4. Change internal products, pricing, and processes to increase customer retention.
Lastly in step 4 it is imperative using root cause analysis and the power of speech/data analytics to trace the underlying reasons behind the customer propensity to churn. Only by harnessing all of the departments or functions that caused the issue in the first place (what we call the “Owners”) will you begin to paint a clear picture of what actions to take. These solutions might embrace changes to your products, pricing, and support processes that can be tested to determine which ones increase customer retention and thereby reduce churn. We always recommend a weekly scrutiny of each of the customer context reason codes especially those in the Investigate or Eliminate quadrants of the Value-Irritant matrix, tracking the intended effects of these product, pricing, and process changes to determine if the rate of those contacts goes down, i.e., if the CPX steadily declines over time. If not, and you see that the CPX increasing, it means going back to steps 1-4.
Notes:
1 “Acquiring a new customer can cost five times more than retaining an existing customer. … The success rate of selling to a customer you already have is 60-70%, while the success rate of selling to a new customer is 5-20%.” Taylor Landis, “Customer Retention Marketing vs. Customer Acquisition Marketing” in Outbound Engine, accessed 5 August 2020.
2 The Best Service is No Service: How to Liberate Your Customers from Customer Service, Keep Them Happy, and Control Costs Bill Price & David Jaffe (Wiley 2008). Based partly on my years as Amazon’s 1st WW VP of Customer Service, but also on “Best Service” providers around the world who have made it easier for their customers to do business with them, we proposed 7 Drivers that start with “Challenge demand for service”:
- “Eliminate dumb contacts”
- “Create engaging self-service”
- “Be proactive”
- “Make it really easy to contact your company”
- “Own the actions across the company”
- “Listen and act”
- “Deliver great service experiences”
3 “Applying Big Data, Skyline, and Snowballs for Contact Optimization”, accessed 30 April 2020


