The phrase “system of record” has been bandied about in martech for years. In the absence of any other context, it’s usually assumed to mean the software that holds the authoritative (or “golden”) customer record. Most often in practice, this is a CRM.
This is why illustrations of martech stacks often have a CRM product such as Salesforce, HubSpot, or Microsoft Dynamics visually placed at their center. (Speaking of which, the 2021 MarTech Stackies are now open for entries — and we’re donating up to $10,000 to COOP Careers on behalf of those who contribute.)
But this assumption often belies that fact that there are many different kinds of data in the modern marketing organization — not to mention the broader domain of rev ops. Each may have its own system of record. And, as with core customer data in CRM, it’s important to identify which system is the “source of truth” for what it provides, so as to minimize data fragmentation, contention, and decay.
It’s okay to have multiple systems of record in your martech stack. But it’s not okay to have multiple systems of record vying for ownership of the same data.
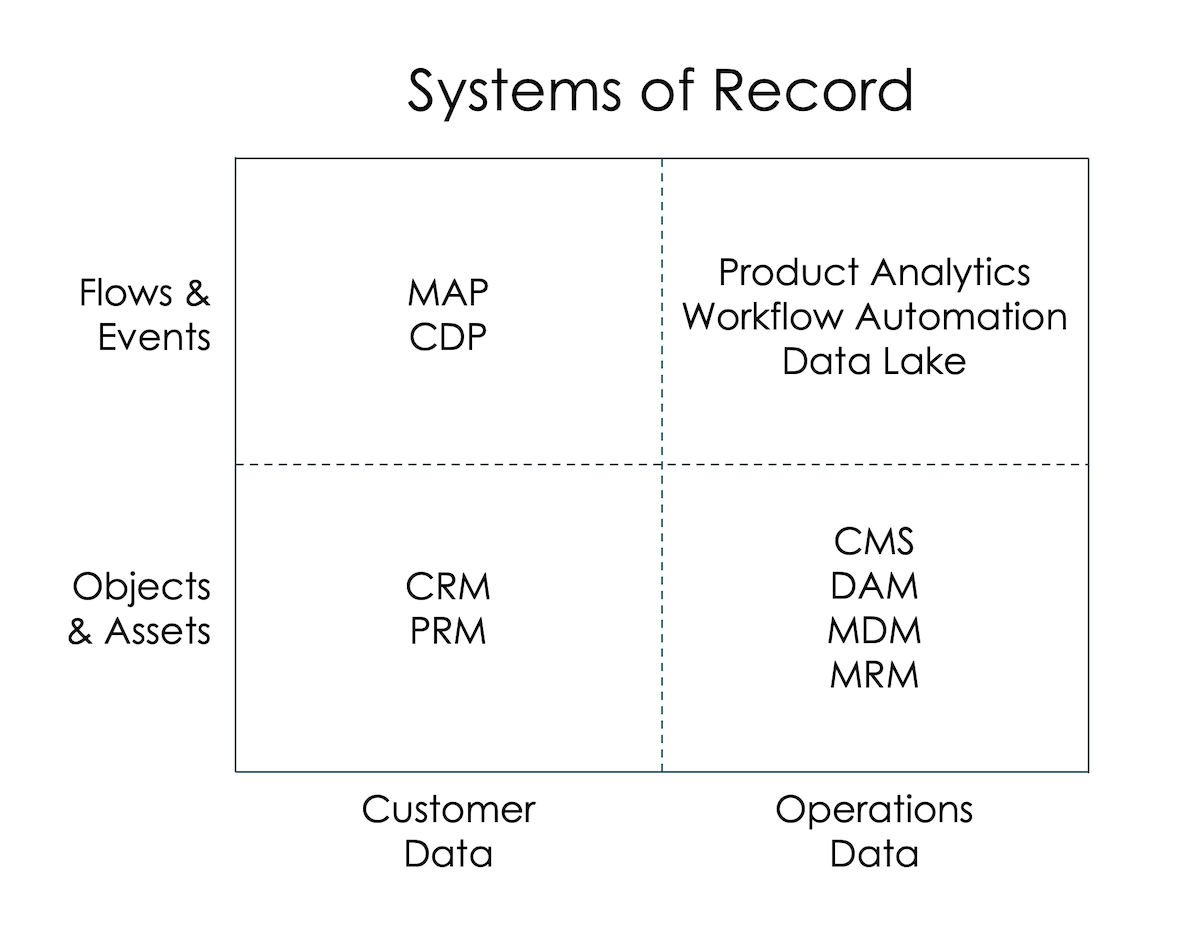
To help think through different kinds of systems of record in a stack, I came up with the 2×2 at the top of this post. It organizes systems along two axes:
- Customer Data — customers and engagements/interactions with them
- Operations Data — production and operation of the business and its digital experiences
- Objects & Assets — relatively “permanent” data and digital entities
- Flows & Events — more fluid and transitory data (often much larger in volume)
A CRM is the quintessential Customer Data system of record that stores relatively permanent objects about customers: contacts, companies, deals, purchases, etc. A DAM, which stores the official versions of content assets such as logos, images, videos, etc., is an example of an Operations Data system of record.
But in digital business, we increasingly deal with more “streaming” data too, what I bucket as Flows & Events. For instance, if you’re tracking website and app interactions customers have with you, you may be using a CDP as a system of record to aggregate that data. From more of the operations side, such data might be feeding into a product analytics platform, such as Amplitude or Pendo.
I know, I know, it’s acronym salad city in that 2×2, so here’s the cheat sheet:
- CRM = customer relationship management
- PRM = partner relationship management
- MAP = marketing automation platform
- CDP = customer data platform
- MRM = marketing resource management
- MDM = master data management
- DAM = digital asset management
- CMS = content management system
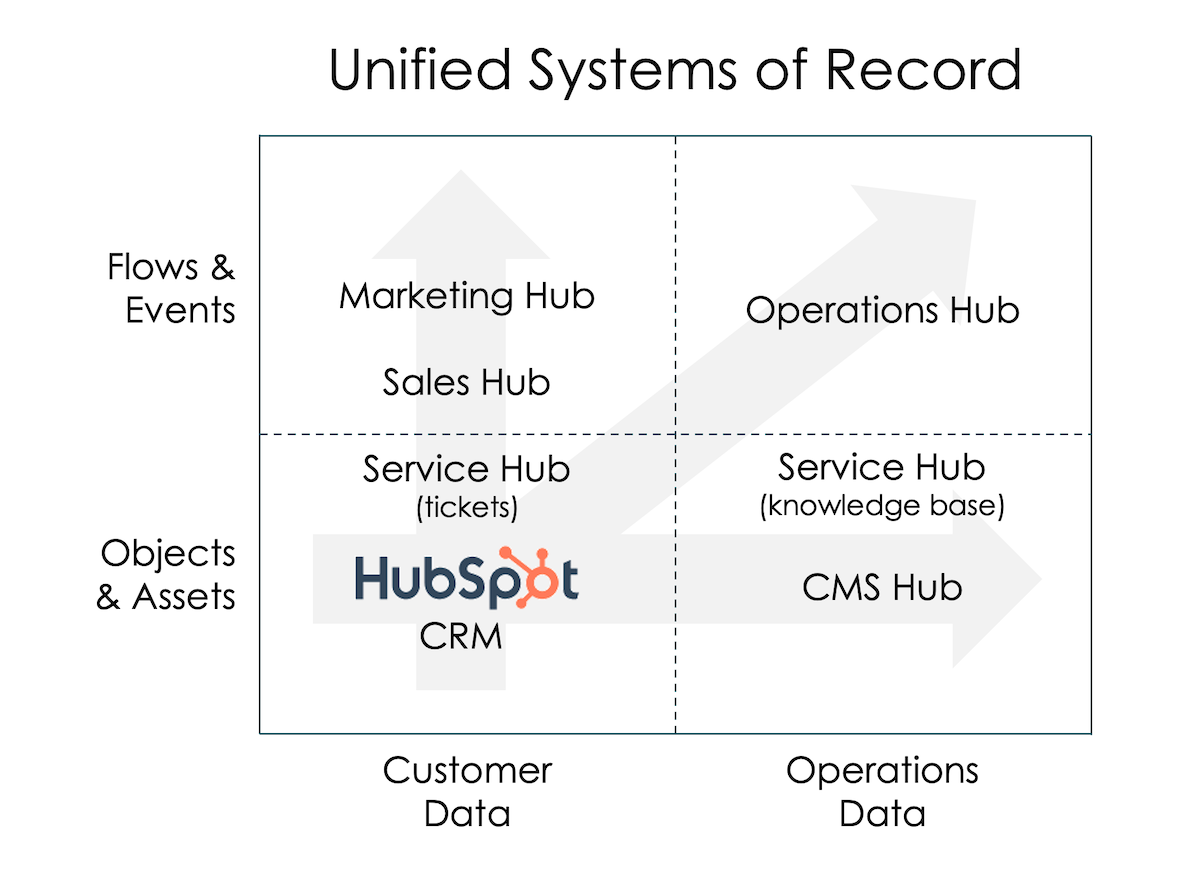
Now, can you have one platform that serves as the system of record across these quadrants? Absolutely. For example, the suite of products that are part of HubSpot’s CRM platform could be mapped into all four quadrants:
Disclaimer: I work at HubSpot. However, this is not an official HubSpot product diagram — just my personal take on how I’d map our products into this systems of record 2×2.
There are advantages to having a common platform foundation across all of these domains. However, when you do see different systems of record within martech stacks, the boundary lines tend to be at the different quadrants. Which makes sense.
We could also debate the placement of different products within quadrants. Should a CDP be in the more permanent Objects & Assets quadrant or Flows & Events? Or span both?
Well, it depends on the CDP and how you’re using it.
I was thinking of how CDPs such as Segment and mParticle are well-suited for managing streaming event/flow data around customer interactions — often integrating with and complementing a CRM — which is why I put them in the upper left corner. But if you have a CDP that is almost more of a B2C CRM, as some are, then it’s probably more in the lower left corner or spanning the left side.
I leave it as an exercise for the reader to place individual logos where you wish.
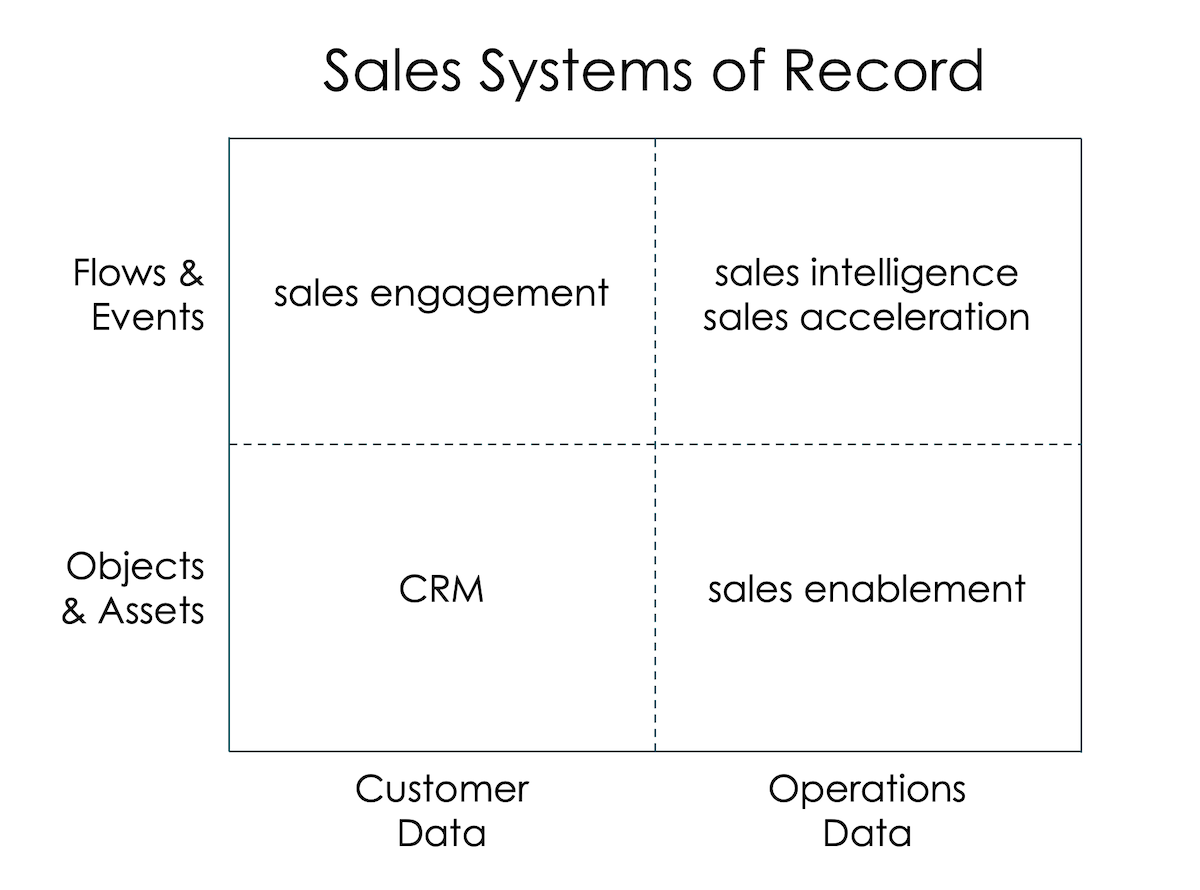
One more related thought. As it’s been said that salestech is the new martech, it’s interesting to see how different categories of sales technologies fit into this 2×2 map as well:


