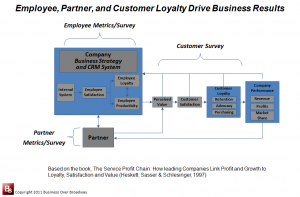
Figure 1. Service Delivery Model Highlights the Impact of Employees and Partners on Customer Loyalty and Business Growth
We have much evidence that effective customer experience management (CEM) needs to include an understanding of your employees’ experience as well as your business partners’ experience with your company. These constituencies are your face to the customers and have an impact on how the customer perceives you. For example, I found evidence that employee metrics, including job satisfaction and number of training hours, were related to customer satisfaction. Specifically, account managers who were more satisfied with their jobs had customers who were more satisfied with the account manager’s performance. Also, technical account managers who took more hours of employee training received higher customer ratings compared to their counterparts who took fewer hours of employee training. Siebel Systems reported that customers were more satisfied with their applications when the third party system integrator (e.g., partner who helped implement the application) was happy.
These findings suggest that improving the customer experience and loyalty depends on effectively managing not only customers themselves – although this is critical – but also effectively managing employees and partners who can directly impact, positively or negatively, the customer relationship.
Understanding the Ecosystem
Effectively managing relationships with all three of these constituencies (e.g., customer, employee and partner) is the key to optimizing customer loyalty, improving your competitive advantage and ensuring long-term financial stability. In Figure 1, we see how these three constituencies ultimately impact company performance (as measured by revenue, profits, market share). Mismanagement of any one of the key constituencies would necessarily lead to poor company performance. To help you effectively managing each constituency throughout their respective life cycle, you need to understand the quality of each of the three relationships.
Life Cycles
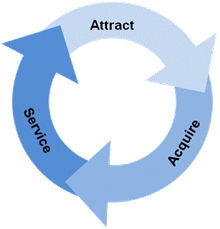
We created a generic life cycle model (see Figure 2) to help us understand the major phases or touch points for each of the constituencies. Generally speaking, each life cycle contains three phases that are common to each: 1) Attract, 2) Acquire, 3) Service. Attraction is about how the constituency discovers you and your offerings. Acquire is about how the constituency comes on board and makes the relationship with you formal. Service is about how the constituency is serviced/managed by you. For the customer, the three life cycle phases would be Market, Sales and Service. For the employee, the three phases would be Recruit, Hire and Manage. For the partner, the three phases would be Market, Enlist and Manage.
Loyalty-Based Approach
We employ a loyalty-based approach to help companies understand where to make improvements to improve the relationship and optimize loyalty of the three key constituencies. From survey design to analysis, we consider loyalty as our ultimate criterion and have developed metrics and analytic methods to support our loyalty-based approach.
Each relationship survey adopts best practices in survey research. Each relationship survey contains four general sections: 1) Loyalty questions, 2) Experience questions, 3) Relative Performance questions and 4) Company-specific questions.
Our analytic approach to the survey data (see Simplifying Loyalty Driver Analysis) helps extract deep insight about each constituency. Using predictive modeling (e.g., correlation, regression analysis), we use the loyalty metrics to identify which business areas (e.g., product, tech support, sales, service) are responsible for driving each type of loyalty. By identifying how much each business area impacts loyalty, you are better able to determine the ROI for different experience improvement initiatives.
Segmentation helps us gain additional insight about the reasons why constituencies are dis/loyal. Examining open-ended comments for specific segments will reveal issues that are common among them, helping you target improvement programs that will address broad constituency concerns.
Integrated Survey Program
Companies use satisfaction surveys – customer, employee and partner – to effectively manage the relationship with each constituency. We developed an integrated survey program to help companies create and maintain high levels of customer loyalty, employee retention and partner allegiance. These key satisfaction surveys enable you to measure and improve relationships and increase loyalty throughout each constituency’s life cycles. These surveys and their key indices appear below.
|
Each company will have its own survey administration timeline, based on their particular needs. We present one in Figure 3 below. For this timeline, survey administration is staggered throughout the year to help facilitate survey management and provide for quarterly reporting for one constituency. The graphic represents a complete annual cycle and the interactions of the various surveys over time.
Summary
Your company is part of a larger ecosystem. Your customers’ experience with your company is impacted by both employees who serve them and partners who help sell/service your solutions to your joint customers. In addition to helping you understand your customers, an effective CEM strategy needs to help you understand your employees and business partners. I presented a loyalty-based approach to help companies manage these three key relationships that will impact the company’s sustainability. Create a great customer experience and improve customer loyalty by harnessing the power of your entire ecosystem.


