
Last month, Watermark Consulting released its latest cross-industry Customer Experience ROI Study.
The study, which has become one of the most widely-cited analyses of its kind, was developed, in part, to address lingering skepticism that many business leaders harbor towards the idea of customer experience differentiation. A lot of lip service is paid to customer experience in the C-Suite, but quite a few executives still view the benefits as soft and intangible, the payoff uncertain.
The study’s white paper (available at the link above) describes the results of the analysis in detail, and also provides insight into what the top companies in customer experience are doing to achieve that distinction. While the white paper is important to read, the chart below is really the centerpiece of the study:
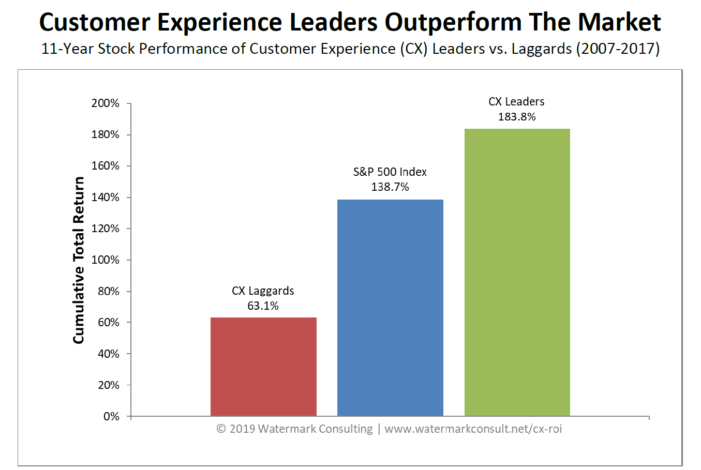
One the face of it, this is a simple chart which depicts the stock market performance for Customer Experience Leading firms, Lagging firms and the broader market (as represented by the S&P 500 Index).
A simple chart, but one with some very significant takeaways that every CEO should absorb. Here are five key ones that deserve attention:
1. A poor customer experience is penalized.
Lots of ink is given to the idea that a great customer experience helps drive great business results (and, as we’ll see in a moment, that’s true). What gets less attention, however, is the cost of doing nothing. The cost of lumbering along with a customer experience that’s at best mediocre and at worst just plain unpleasant.
However, as this chart illustrates, companies that deliver a poor customer experience pay a price for that over the long-term (in this case, delivering a shareholder return which was one-third that of the CX Leaders, and less than half that of the broader market).
2. A great customer experience is rewarded.
The benefits of a great customer experience aren’t soft and fuzzy. Differentiation along this axis creates both strategic and economic advantages which help build business value.
How much value? As the chart shows, in this study, CX Leaders delivered a shareholder return that was 45 points greater than the broader market. Even more impressive, the CX Leaders outperformed the CX Leaders by a whopping 120 points.
To put it another way, CX Leaders generated an average annual return that was more than twice that of the CX Laggards. That hardly qualifies as a soft and fuzzy benefit.
3. It’s the long game that matters.
The chart depicts the aggregate performance of CX Leaders and CX Laggards over an eleven-year period. Might there be a year where a most-loved company underperforms a most-hated one? Absolutely. (This story about Borders Books is instructive in that regard, and explains why a great customer experience doesn’t guarantee business success.)
The key point, however, is that when the time horizon is measured in years (not quarters), that’s when the prizes (or penalties) associated with a company’s customer experience really start to accrue.
4. There are two parts to the customer experience economic equation.
Why are the CX Leaders delivering a shareholder return that’s so much greater than that of the CX Laggards? It’s because the market views the Leaders to be more valuable businesses than the Laggards – meaning those firms are expected, by investors, to generate relatively higher earnings in the future.
But what exactly is driving those higher earnings (and associated valuations) for the CX Leaders?
Many people mistakenly think it’s all about revenue growth: a better customer experience means higher retention, better cross-selling, more referrals, etc. While that’s accurate, it’s only one side of the story, because a great customer experience also helps to better control and even reduce expenses.
This helps explain the magnitude of the performance differential between CX Leaders and CX Laggards. The Leaders are enjoying higher revenues, better controlled expenses, and greater profitability as a result. The Laggards’ valuation (and subsequent appeal to investors) is dragged down by just the opposite – depressed revenues, uncompetitive cost structures and an earnings future that’s far less attractive.
5. These lessons apply to both public and private entities.
While the chart depicts the stock performance differential for publicly-traded companies, the takeaways from the analysis (and the preceding four points) apply to private firms, as well.
That’s because what the chart is really saying is that companies which deliver a great customer experience over the long-term are simply more valuable than those that do not. That finding has relevance to any organization, regardless of its ownership structure, and it’s a message that every CEO should take to heart.


Really good article – plus supporting metrics on the chart – showing the relationship between CX proficiency and financial success. No doubt that it is always of long-term benefit to deliver quality customer experience.