
LinkedIn is known worldwide as the professional social media platform, where individuals and businesses can network and connect. More concerned with business than cat videos or politics, it is the perfect B2B marketing platform. LinkedIn’s impressive user list of over 30 million companies is a target-rich environment for savvy marketers.
To get the most mileage from your LinkedIn marketing, you need to understand LinkedIn analytics. This veritable goldmine of usable data can help you make sense of the many active companies on LinkedIn’s platform. Here’s how to use it to improve your B2B marketing efforts.
What is LinkedIn Analytics?
According to LinkedIn’s internal research, nearly 63 million decision makers scroll their news feed each month. That’s a lot of potential B2B leads! LinkedIn analytics are a set of metrics that help you measure your company page’s performance and the performance of the content you post there.
Where to Find Your LinkedIn Analytics
First, log in to LinkedIn and go to your company page.
On the left-hand side, you should see some basic analytics. If you click any of the metrics, it will take you inside your Analytics dashboard. The dashboard is where you’ll find all the insights and analytics provided by LinkedIn.
The 3 Categories of LinkedIn Analytics
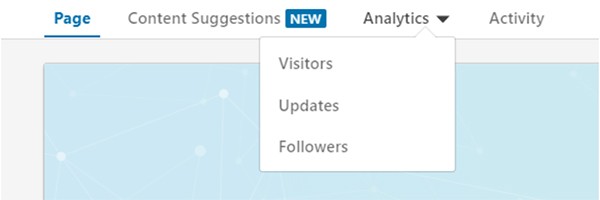
LinkedIn made analytics navigation easy by separating their metrics into three main categories.
The data found in Visitors, Updates, and Followers is Metrics are sortable by metric. Having tools that allow easy analysis helps determine the source of your marketing campaign’s ROI.
Let’s look at the three categories, what you can learn from each, and get tips on using that data to your advantage.
1. Visitors
Simply put, Visitors are the people who land on your page. The analytics under the Visitors tab indicate where your monthly leads are coming from. Considering that LinkedIn is more than 277% more effective at lead generation than other social media sites, it’s advantageous to know the source of your visitors.
Inside Visitors, you’ll find these useful analytics that matter:
Unique Visitors
Visitors may come to your page several times to check out info, read up on your company, or find your website. The Unique Visitors metric does not factor multiple visits into its algorithm, hence the “unique” label.
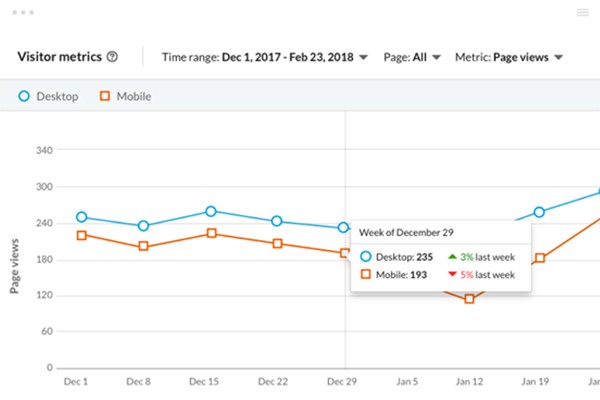
Page Views
Page Views are straightforward — they measure how many visitors viewed your page. This metric doesn’t measure engagement, only eyeballs on the page.
Visitor Demographics
Visitor Demographics is useful in determining if targeted campaigns are working for your targeted demographics. You can see a breakdown of company size, job level, industry, and location. This data helps you understand where your leads are coming from in terms of both region and vertical.
2. Followers
The Followers category measures people who follow your company’s page. These are people or companies who are committed to following you, not just random viewers who visit your page.
Inside Followers, you’ll find these useful analytics that matter:
Total Followers
Total Followers is the sum of your total followers to-date. This number is updated in real-time and reflects everyone who follows you.
Gain or Loss
This metric displays a graph that shows the net gain or net loss of followers over the past month.
Organic Followers
Organic Followers refers to the number of followers who find you through organic reach.
Sponsored Followers
Sponsored followers are just the opposite of organic followers.
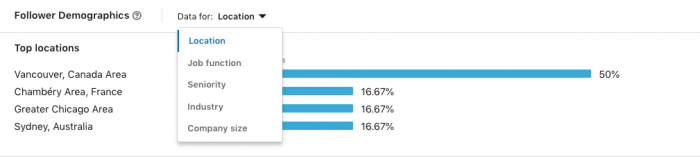
Follower Demographics
Much like Visitor Demographics, LinkedIn gives you a nice breakdown of your followers’ demographics.
Follower Trends
Follower Trends is a chart that depicts when your followers added your company page.
3. Company Updates
Company Updates are helpful to get a big picture view of how your content is performing on LinkedIn.
Unique Impressions
Each impression represents the total number of eyeballs on your post. Whether it made an “impression” or not reflects in the metrics.
Engagement Rate
Engagement Rate is a proprietary blend of a few key metrics: clicks, likes, comments, shares, and follows — all divided by the total number of impressions.
Video Views
Video Views lets you know how your videos performed. With video on the rise, it is always a great idea to include video posts to see an uptick in your engagement.
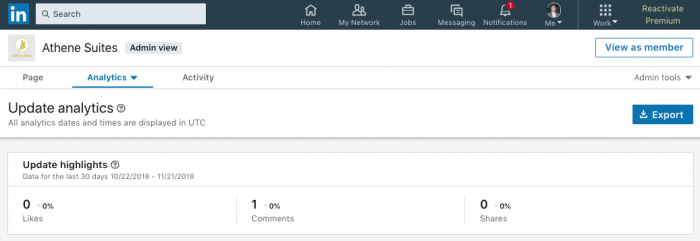
Update Highlights
This section will show you the number of shares, likes, and reactions to your content.
Clicks
Just as the name implies, this represents the total number of clicks you get. Keep in mind this is important, but not as important as the Click-Through Rate.
Click-Through Rates (CTR)
CTR tells you how many clicks you received per impression, which is a significant factor in determining how engaging your content is.
LinkedIn Analytics Gives You Leverage
LinkedIn analytics are instrumental in creating a winning B2B marketing campaign. But when tracking those analytics, it’s vital that you know your company’s marketing goals. Ultimately, having the right B2B LinkedIn strategy is paramount to your success as a marketer.
Using your analytics data strategically allows you to leverage your page visitors. Then you can better handle who your B2B prospects are and what they like.


