
There is much talk of Big Data and how it is changing/impacting how businesses improve the customer experience. In this week’s post, I want to illustrate the value of Small Data.
Internet Service Providers (ISPs) receive the lowest customer satisfaction ratings among the industry sectors measured by the American Customer Satisfaction Index (ACSI). As an industry, then, the ISP industry has much room for improvement, some more than others. This week, I will use several data sets to help determine ISP intra-industry rankings and how to improve their inter-industry ranking.
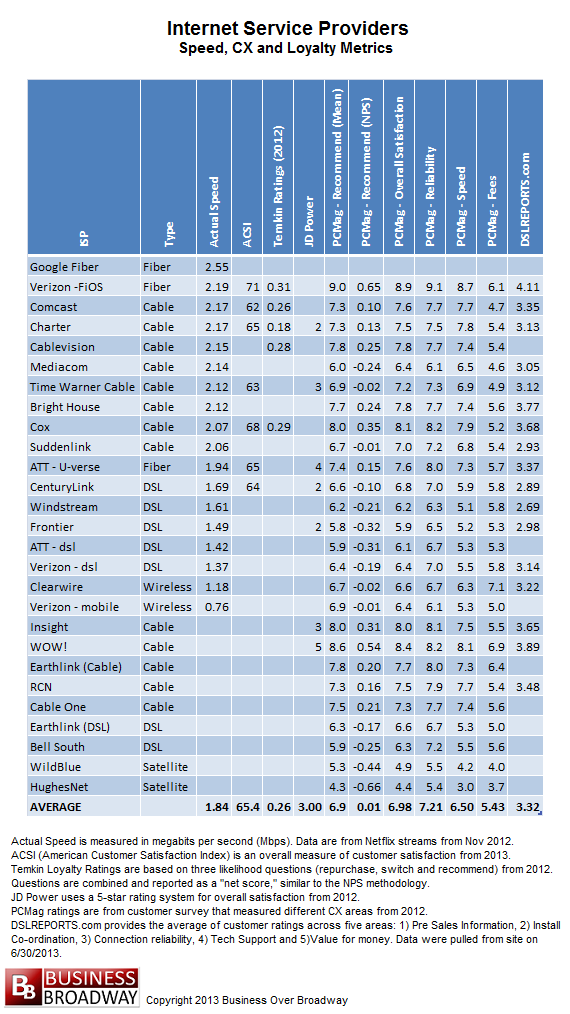
Table 1. Internet Service Provider Ratings
I took to the Web to find several publicly available and relevant data sets regarding ISPs. In all, I found 12 metrics from seven different sources for 27 ISPs. I combined the data sets by ISP. By merging the different data sources, we will be able to uncover greater insights about these different ISPs and what they need to do to increase customer loyalty. The final data set appears in Table 1. The description of each metric appears below:
- Broadband type: The types of broadband were from PCMag article.
- Actual ISP Speed: Average speed for Netflix streams from November 2012: Measured in megabits per second (Mbps).
- American Customer Satisfaction Index (ACSI): an overall measure of customer satisfaction from 2013. Ratings can vary from 0 to 100.
- Temkin Loyalty Ratings: Based on three likelihood questions (repurchase, switch and recommend) from 2012. Questions are combined and reported as a “net score,” similar to the NPS methodology. Net scores can range from -100 to 100.
- JD Power: A 5-star rating system for overall satisfaction from 2012. 5 Star = Among the best; 4 Star = Better than most; 3 Star = About average; 2 Star = The rest.
- PCMag Ratings (6 metrics: Recommend to Fees): Ratings based on customer survey that measured different CX areas in 2012. Ratings are based on a 10-point scale.
- DSL Reports: The average customer rating across five areas. These five areas are: 1) Pre-Sales Information, 2) Install Coordination, 3) Connection reliability, 4) Tech Support and 5) Value for money. Data were pulled from the site on 6/30/2013. Ratings are based on a 5-point scale.
As you can see in Table 1, there is much missing data for some of the 27 ISPs. The missing data do not necessarily reflect the quality of the data that appear in the table. These sources simply did not collect data to provide reliable ratings for each ISP or simply did not attempt to collect data for each ISP. The descriptive statistics for and correlations among the study variables appear in Table 2.
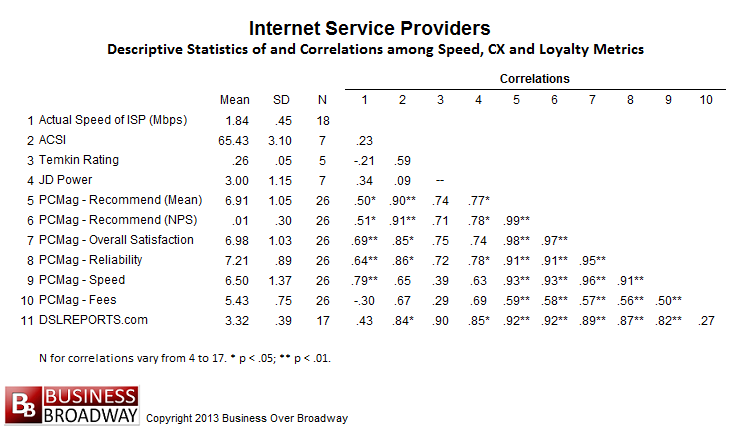
Table 2. Descriptive Statistics of and Correlations among Study Variables
It’s all about Speed
Customer experience management research tells us that one way of improving satisfaction is to improve the customer experience. We see that actual speed of the ISP is positively related to most customer ratings, suggesting that ISPs that have faster speed also have customers who are more satisfied with them compared to ISPs who have slower speeds. The only exception with this is for satisfaction with Fees; ISPs with faster actual speed tend to have customers who are less satisfied with Fees compared to ISPs with slower actual speed.
Nate-Silvering the Data
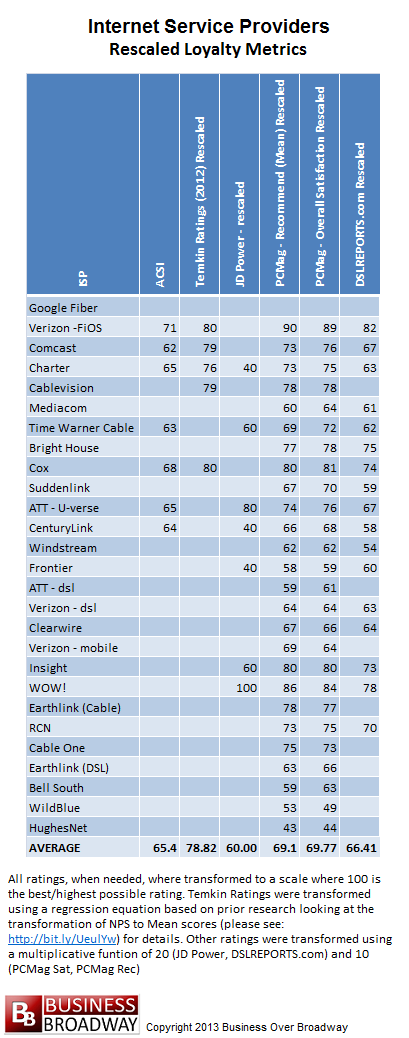
Table 3. Rescaled Values of Customer Loyalty Metrics for Internet Service Providers
Recall that Nate Silver aggregated several polls to make accurate predictions about the results of the 2012 presidential elections. Even though different polls, due to sampling error, had different outcomes (sometimes Obama won, sometimes Romney won), the aggregation of different polls resulted in a clearer picture of who was really likely to win.
In the current study, we have five different survey vendors (ASCI, Temkin, JD Power, PCMag and DSLREPORTS.com) assessing customer satisfaction with ISPs. Depending on what survey vendor you use, the ranking of ISPs differ. We can get a clearer picture of the ranking by combining the different data sources because a single study is less reliable than the combination of many different studies. While the outcome of aggregating customer surveys may not be as interesting as aggregating presidential polls, the general approach that Silver used to aggregate different results can be applied to the current data (I call it Nate-Silvering the data).
Given that the average correlations among the loyalty-related metrics in Table 2 are rather high (average r = .77; median r = .87), aggregating each metric to form an Overall Advocacy Loyalty metric makes mathematical sense. This overall score would be a much more reliable indicator of the quality of an ISP than any single rating by itself.
To facilitate the aggregation process, I first transformed the customer ratings to a common scale, a 100 -point scale using the following methods. I transformed the Temkin Ratings (a net score) into mean scores based on a mathematical model developed for this purpose (see: The Best Likelihood to Recommend Metric: Mean Score or Net Promoter Score?). This value was then multiplied by 10. The remaining metrics were transformed into a 100-point scale by using a multiplicative function of 20 (JD Power, DSLREPORTS) and 10 (PCMag Sat, PCMag Rec). These rescaled values are located in Table 3. While the transformation altered the average of each metric, these transformations did not appreciably alter the correlations among the metrics (average r = .75, median r = .82).
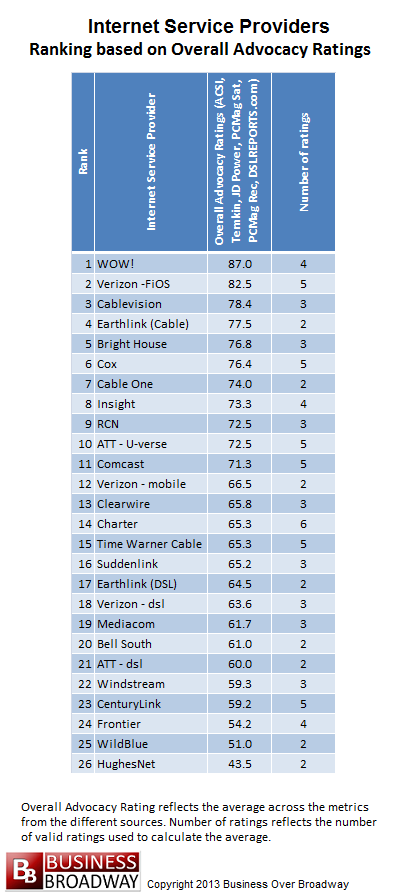
Table 4. Rankings of Internet Service Providers based on the average loyalty ratings.
The transformed values were averaged for each of the ISPs. These results appear in Table 4. As seen in this table, the top 5 rated ISPs (overall advocacy ratings) are:
- WOW!
- Verizon FiOS
- Cablevision
- Earthlink
- Bright House
The bottom 5 rated ISPs (overall advocacy ratings) are:
- Windstream
- CenturyLink
- Frontier
- WildBlue
- HughesNet
Summary
Small Data, like its big brother, can provide good insight (with the help of right analytics, of course) about a given topic. By combining small data sets about ISPs, I was able to show that:
- Actual ISP speed is related to customer satisfaction with speed of ISP. ISPs that have objectively faster speed receive higher ratings on satisfaction with speed.
- Different survey vendors provide reliable and valid results about customer satisfaction with ISPs (there was a high correlation among different survey vendors).
- Improving customer loyalty with ISPs is a function of actual ISP speed.
The bottom line is that you shouldn’t forget the value of small data.


I think many people get lost in the idea of big data when what would move the needle for them effectively is the small data they have. Most data isn’t big, but data specific to your company and customers or competitors can make a big difference.