
A pricing survey helps you determine how much people value your product and what they’re willing to pay for it. Instead of guessing what price might be successful based on varying competitor prices or what seems like a fair markup on your product or service, pricing surveys can pinpoint your optimal price based on real data from your target customers.
Why are pricing surveys important?
Pricing surveys are an essential way to make sure you’re pricing your products correctly. Choosing a price for your product or service is a very complex process, and there are a lot of external factors that ultimately determine if people will pay for your product or not.
A pricing survey (done well) will help reveal what’s really behind your customers’ purchase decisions and give you the answers you need to optimize your pricing strategy.
Using a pricing survey, you can determine your acceptable price range, what features customers are willing to pay the most for, the value your brand has against your competitors, and more. And it all starts with survey questions.
How to ask pricing questions in a survey
How you ask your pricing questions depends on the type of analysis you want to do and the answers you’re looking for. There are some simple methods of asking pricing questions that can give you a ballpark figure of where your price should be, and then there are more advanced pricing analysis tools that can tell you exactly how much value each feature of your product adds, and how much more you can charge for it.
Pricing survey example questions
First, let’s take a look at two simple ways of asking customers about their willingness to pay. The first question uses a free text format where respondents enter their own amounts:
How much would you be willing to pay for {this product/service}?
This is the simplest way of getting a starting price point for your product or service. However, the challenge with this question is that respondents aren’t taking competitor prices or other external factors into account. This means that their answers may not accurately reflect what they’d be willing to pay when faced with alternatives.
This is especially true if customers are unfamiliar with your product and they don’t have a realistic idea of how much it would cost. But if consumers are fairly familiar with your product or service category, it can give you a general idea of what prices come to mind. Another option is to use a price rating scale:
If {this product/service} was priced at ${price}, how likely would you be to purchase it?
- Very likely
- Somewhat likely
- Neither likely nor unlikely
- Somewhat unlikely
- Very unlikely
A direct question like this can be used to gauge customers’ acceptance of a specific price point. However, by only evaluating pre-determined price points, you may not be able to fully understand what value customers would place on your product. In addition, respondents tend to be overly optimistic and even though they say they are likely, they may not be considering how other alternative products would affect their decision.
In order to get more in-depth data from your survey and determine your optimal price, you’ll want to use other types of analysis. Here are two main pricing analysis techniques we’ll cover:
- The Van Westendorp Pricing Model
- Conjoint Analysis
Don’t worry, they’re not as confusing as they sound. Let’s dive into what these techniques can do.
The Van Westendorp Pricing Model
The Van Westendorp Pricing Model (or price sensitivity meter) is a research method designed to help you position your product by gauging consumers’ perception of its’ value. This technique uses a series of four survey questions that allow you to indirectly measure what consumers perceive to be an acceptable price range for your product. In your survey, you would first present a description of your product or service and then ask respondents the following questions:
- At what price would you begin to think the {product/service} is so inexpensive that you would not buy it because you questioned its quality? {text box}
- At what price would you think the {product/service} is a good value? {text box}
- At what price would you think the item is slightly expensive, but you still might consider it? {text box}
- At what price would you begin to think the item is too expensive to consider purchasing? {text box}
These questions allow you to see at what price points respondents perceive your product to be too cheap, cheap, expensive and too expensive. When you graph this data, you can then determine your optimal price point based on where the lines for each category intersect. You can also determine your value positioning price point, premium positioning price point, and acceptable price range.
If you have experience building cumulative frequency graphs, you can do this analysis yourself, or you can use a survey platform with a team that will build the charts and analyze your results for you. The Van Westendorp Pricing Model is relatively easy to implement and can provide better insights than standalone willingness to pay questions, but it still has limitations.
Disadvantages of the Van Westendorp Pricing Model
There are two major downfalls of the Van Westendorp Pricing Model: It doesn’t provide context and it doesn’t take into account any features of your product other than the price.
It lacks context because it doesn’t allow respondents to compare competitor prices and products. In the real world, purchase decisions are rarely an isolated choice. Competitor prices can heavily influence a customer’s willingness to pay for your product, which is not captured in the Van Westendorp Model.
Another limitation is that the Van Westendorp Model doesn’t consider or evaluate specific features of the product, which also have a big impact on customers’ willingness to pay. You won’t be able to measure which of your features are adding the most value to your product or what combination is the most profitable.
This is why it’s important to dive deeper into your pricing research with conjoint analysis. If you choose to use a Van Westendorp Model as a starting point, you can use conjoint analysis to validate your results and find out more about your customers’ preferences.
Price it right with Conjoint Analysis
Conjoint analysis is a highly effective way to measure how much consumers value certain features or attributes of your product/service. This technique breaks your product down into its’ main attributes (and levels of those attributes) and asks respondents to make choices based on combinations of those attributes (to reveal their preferences). These attributes could include things like size, design, brand, claims, price and more.
There are a couple of types of conjoint analysis, but the most common and most effective is choice-based conjoint. Choice-based conjoint (or discrete choice) analysis uses different combinations of your product attributes to create product profiles and then asks respondents to choose between these different product concepts. Here’s an example of what a respondent would see during a discrete choice exercise.
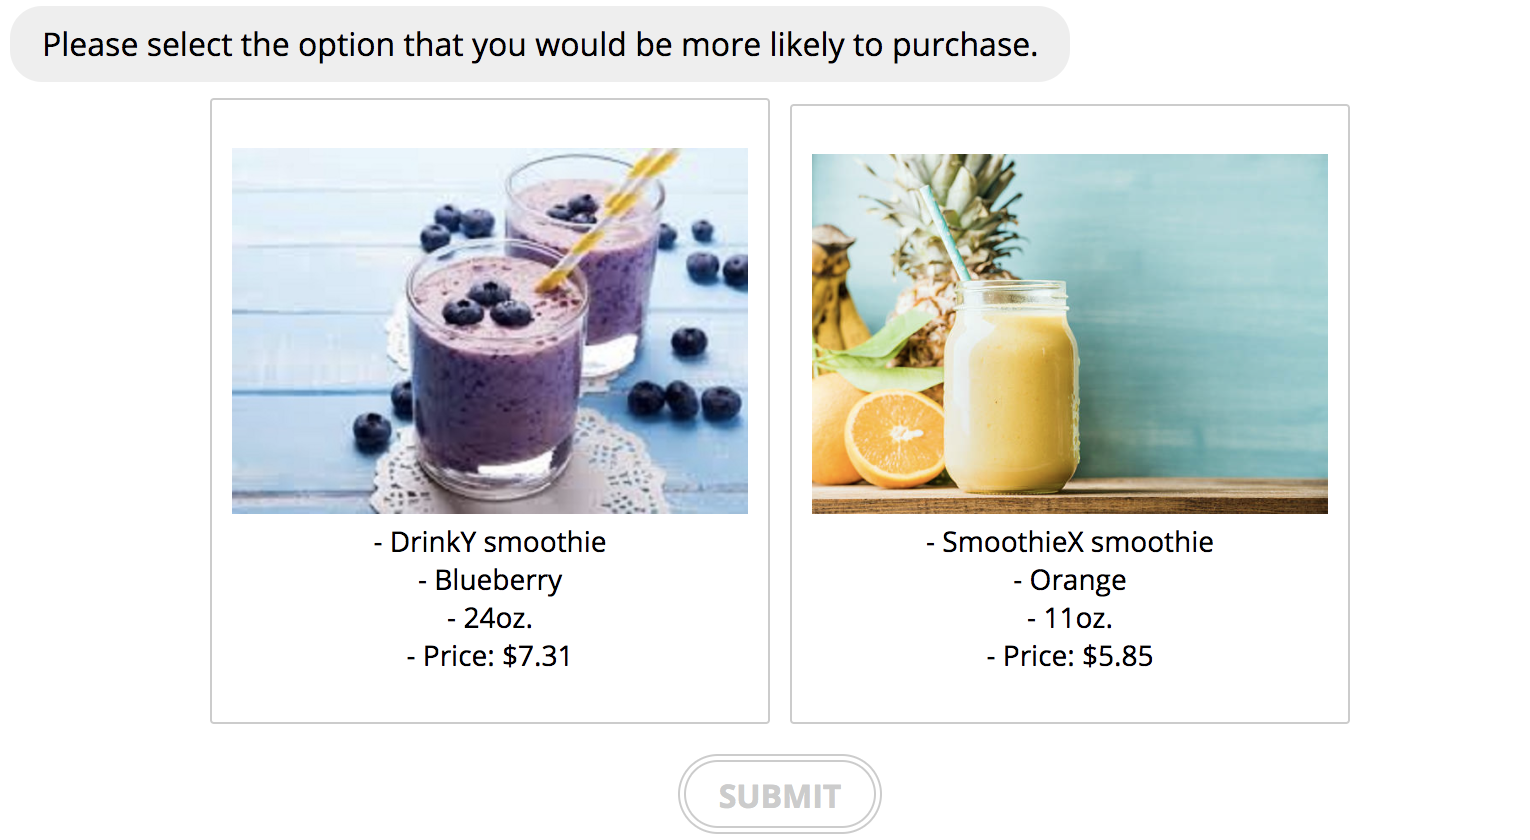
This method simulates a more realistic buying scenario where consumers have to choose between alternatives. This means you’ll get more realistic data on consumers’ willingness to pay based on the choices they actually make– not just what they say they’ll pay. What’s more, you can measure the isolated impact of specific features of your product. Another advantage of this setup is that you can include competitor product profiles, so you can use brand as an attribute and measure exactly how much value your brand name adds to your product.
The result?
With choice-based conjoint analysis, you can see exactly how much value consumers place on your product attributes and what combination they’re willing to pay the most for, so you can set your prices accordingly.
Furthermore, you can use additional models to solidify your pricing decisions. For example, using a probability of purchase model (likelihood people will buy your product) you can measure the price premium of a specific feature and come up with a price point that makes your product attractive compared to your competitor’s offerings.
Another possibility is to use a market share model to measure the impact of changing the price of your product, or introducing a new product, on your brand’s market share (i.e. the percentage of sales your company captures in your industry).
However, all of these great insights require more advanced statistics and analytical capabilities. Thankfully, GroupSolver® can do all of this for you. From survey set up to full-scale pricing analysis– our advanced survey platform makes finding your optimal price easy.
Learn more about our technology and research solutions or contact us for a quick demo of our platform.


