
Data professionals prefer analytics tools over business intelligence tools when getting insights from their data. Nearly half of data professionals surveyed in Kaggle’s 2020 Data Science and Machine Learning Survey said they do not use BI tools. The top tool used by data professionals to analyze data are local development environments (48%), followed by basic statistical software (30%). Analytics and BI tool usage differed across respondents’ job titles.
Data professionals use a variety of data science tools, technologies and languages to help them get insights from data. Because data analysis is central to the gaining insights from data, we focus on tools that relate to analyzing data. Kaggle recently conducted a worldwide survey of nearly 20,000 data professionals (see: 2019 Kaggle ML and Data Science Survey The survey asked a variety of questions, including the tools used to analyze data.
Top Tools Used to Analyze Data
The survey asked respondents, “What is the primary tool that you use at work or school to analyze data?” The top tools used to analyze data was, by far, Local development environments (RStudio, JupyterLabs, etc.) (48%). The complete list of tools were (See Figure 1):
- Local development environments (RStudio, JupyterLabs, etc.) (48%)
- Basic statistical software (Microsoft Excel, Google Sheets, etc.) (30%)
- Business intelligence software (Salesforce, Tableau, Spotfire, etc.) (6%)
- Advanced statistical software (SPSS, SAS, etc.) (6%)
- Cloud-based data software and APIs (AWS, GCP, Azure, etc.) (5%)
- Other (3%)
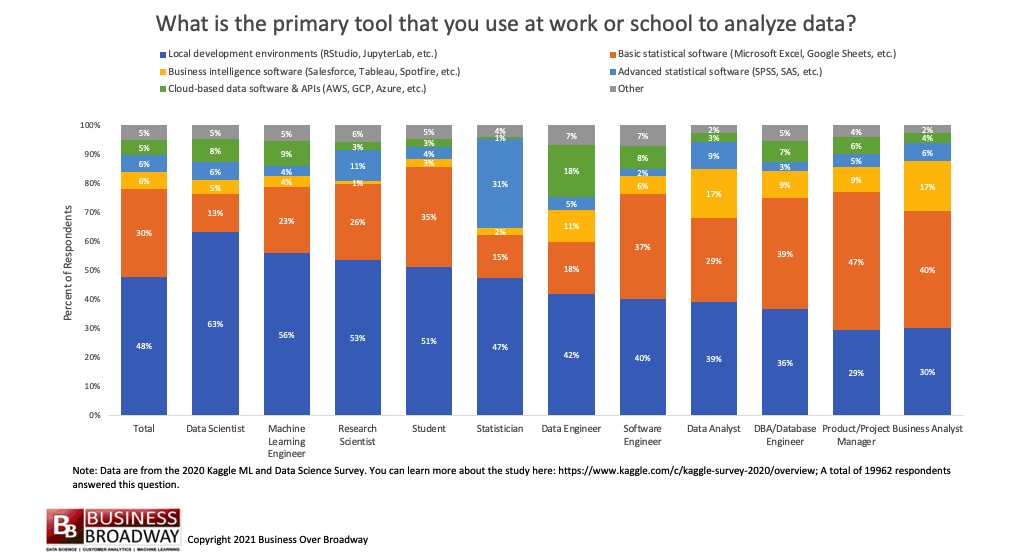
There were differences in tool usage by respondents’ job title. Local development environments were the top tool for the majority of job titles, with the exception of DBA/Database Engineer and Product/Project Manager whose top pick was basic statistical software. The second most popular tool varied by job title:
- Basic statistical software: Data Scientist, Machine Learning Engineer, Research Scientist, Student, Software Engineer and Data Analyst.
- Cloud-based data software and APIs: Data Engineer
- Advanced statistical software: Statistician
- Local development environment: DBA/Database Engineer, Product/Project Manager and Business Analyst
Top Business Intelligence Tools Used
Business intelligence (BI) is a process for analyzing data and delivering actionable information that helps executives, managers and workers make informed business decisions. Based on the previous survey question, only 6% of respondents said they used Business Intelligence (BI) Software. The survey also included two questions focused specifically on BI tools used by data professionals. For these two questions, we combined the results to understand BI tool usage. If respondents indicated they use multiple BI tools (“Which of the following business intelligence tools do you use on a regular basis? (Select all that apply”), they were asked “Which of the following business intelligence tools do you use most often?” A total of 6723 respondents provided answers these questions to get at the most often used BI tools used. The results appear in Figure 2.
Nearly half of respondents (46%) said that they did not use BI tools. The top BI tool used were:
- Tableau (19%)
- Microsoft Power BI (16%)
- Google Data Studio (6%)
- Qlik (2%)
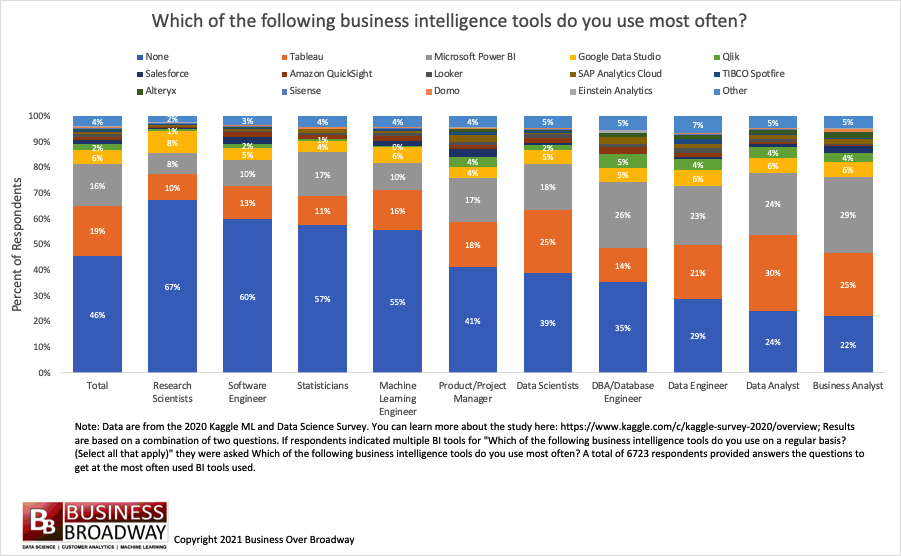
There were differences in BI tool usage across job titles. First, less than half of the data professionals with the following job titles use BI tools:
- Research Scientist (33% use BI tools)
- Software Engineer (40%)
- Statisticians (43%)
- Machine Learning Engineers (45%)
A majority of the following data professionals use BI tools:
- Business Analysts (78% use BI tools)
- Data Analyst (76%)
- Data Engineer (79%)
- DBA/Database Engineer (65%)
- Data Scientist (61%)
- Product/Project Engineer (59%)
Conclusions
There are a variety of tools that data professionals can use to get value from their data. This study looked at two broad categories of tools: 1) Analytics and 2) Business Intelligence. The top analytics tools used, by far, were associated with local development environments like RStudio and JupyterLabs. These tools allow you to develop and test your analytics without sharing it with others (until you are satisfied with it). Because Data Scientists and Machine Learning engineers do a lot of their work on machine learning algorithms that require much tweaking and testing, it’s not surprising that a majority of these data professionals use this approach. The most popular BI tools used were Tableau and Microsoft Power BI. These tools were primarily used by Business Analysts and Data Analysts.
Advanced statistical software like SPSS and SAS are popular with statisticians. These types of tools allow users to easily apply much more sophisticated analytics on their data compared to Microsoft Excel or Google Sheets, including analyses like principal component analysis for data reduction, regression analyses and more. It’s clear that no single tool will do it all. Different data professionals, depending on their needs, will likely need to use a set of applications for their data project. Selecting the right data analytics tool will definitely improve your chances of success in your data projects.


