I’m often asked for customer journey mapping examples – where are organizations using journey mapping that is truly driving change.
Of course, the results vary significantly depending on the selected business problem, journey, and customer selected – three of our five questions. Two similar organizations can have very different outcomes based on how they answer the question.
Customer Journey Mapping Examples:
To illustrate, my two favorite examples are direct competitors who both wanted to understand the life insurance purchasing journey. Their business problems were very different. I couldn’t go into them in a public space, and their journey was the same. However, they chose different customers, leading to separate outcomes and distinct innovations.
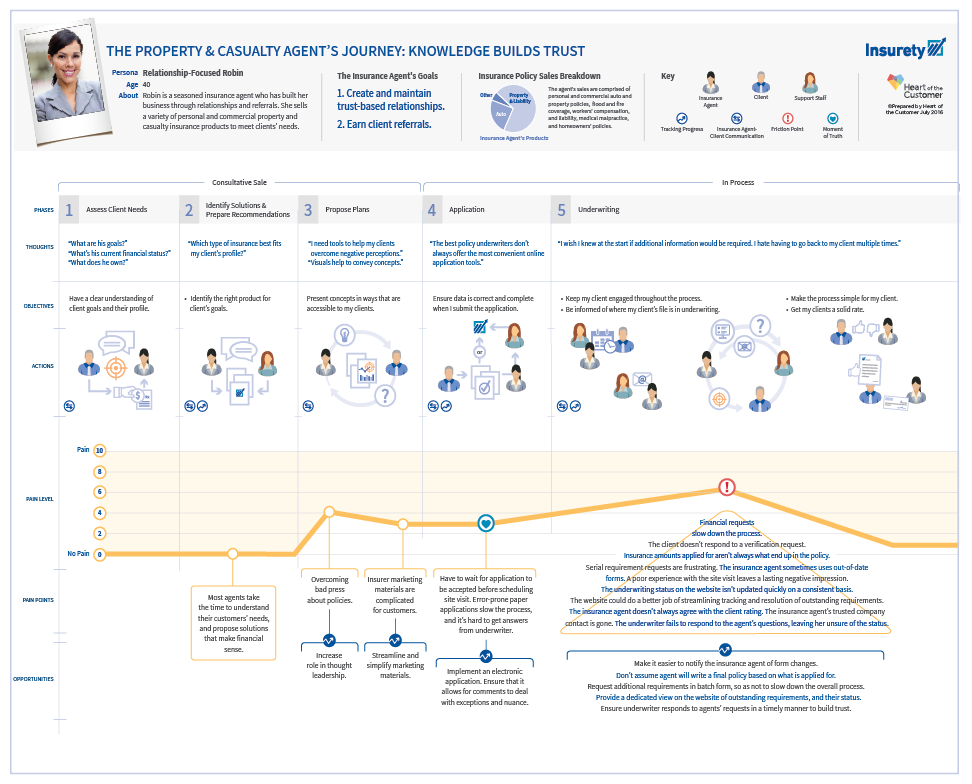
Both organizations go to market through independent financial professionals (FinPros) in a B2B2C model. In most cases, when B2B2C companies are asked the question “Who is the customer?” it generates different answers within a company. Company A was focused on improving the outcomes for its agents. They were already looking to change the journey. They wanted to ensure that the changes were based on the voice of the customer. Therefore, we visited dozens of FinPros in different cities (both examples occurred before the pandemic) to learn what it’s like to work with Company A. The results can be found here. Don’t read it, because we changed all the content and switched the journey from life insurance to P&C. However, you can sense there was one phase, towards the end of the journey, where the FinPros experienced the “Mountain of Pain.” Poor tools and a lack of expectations combined created friction.
Company A:
- When we conducted Hypothesis Mapping at the beginning of the project, we called Company A, the FinPros, “Producers.” This language led the participants to focus on how the producers hoped to earn enough money for their new boat or second home. Then we switched the language to “FinPros” during the second project, which was about annuities. FinPros were consultative, relationship-focused business people, pillars of their community. They were more focused on helping their clients succeed. Of course, these were the same people. The language change changed the tone.
- We also shared more details about the FinPros, proving that the second description was far more accurate. As a result, Company A has primarily abandoned the word “Producer.”
- During the Hypothesis Mapping phase, we discovered that employees felt that Company A was complicated to work with. When we spoke with leadership at the FinPros, they told us, “I wish every company was as easy to work with as Company A!”
- When we created this map, we didn’t realize that Insurety was the name of an honest company!
Company B:
In contrast, Company B focused on the potential Policyholder. They wanted to improve its uptake on life insurance and desired to win more FinPro business by making a better experience for that FinPro’s customers.
For this journey, we used a digital ethnography to follow potential policyholders as they engaged with Company B for over a month. This approach allowed us to follow participants as they went through the process. You may be familiar with Daniel Kahneman, who says we suffer under the “Tyranny of the Remembering Mind.” He means that most of our experiences are filtered out. The memories that stick are disproportionately impacted by the peak point of emotion and the ending of the experience. And since the only thing we genuinely create in customer experience is a memory; we needed to ensure we captured both the remembering and the experiencing mind since both are relevant.
We conducted interviews with those who had completed the journey to capture the Remembering Mind. Then we followed this with a one-month digital ethnography. This enabled us to interact with the experiencing mind as the process unfolded. A digital ethnography is an online platform where participants can document their thoughts, conduct exercises, and upload videos.
Download our Journey Mapping White-papers, Here.
The Results:
The results were interesting and distinct from what Company A learned.
- First, Kahneman’s work was supported. While those we interviewed had things to say about the experience, details were minimal. Additionally, some of the specifics they shared seemed to be untrue. This wasn’t a surprise, as the research predicts this. It’s common for companies to manufacture memories when forced to create details that were never retained. The participants weren’t lying, they believed their memories.
- The digital ethnography provided much clearer detail on where the process went badly, from poor communication to a lack of expectations, which helped us to understand why the interview participants felt the way they did. It’s not that one methodology is better than the other, but that instead, you need to use both to get a full picture.
- (You may be asking why we didn’t use a digital ethnography for Company A. The primary reason is that we rarely use this approach with B2B experiences, as it’s challenging to get that level of participation over time.)
What we Learned:
We learned something that at first suggested that Kahneman was wrong. This is, of course, ludicrous – I’m never going to tell that my research is better than Kahneman’s (big fanboy here).
Our most compelling finding was that the attitude of someone coming into the journey was the most predictive of how they felt at the end of the experience. In the beginning, we asked them how they felt about getting life insurance. 37% entered positive, 13% were neutral, and half came in feeling negative. Once the journey was over, all of the positives and neutrals ended positive, and 2/3 of the negatives ended.
Those who follow Kahneman argue that you need to design the ending to end on a high point. And that’s correct. But those same advocates often neglect the beginning since it’s not what customers remember. But those fanboys (i.e., me) would do well to remember another finding of Kahneman’s, called the “excessive coherence” heuristic. It’s related to confirmation bias, and it simply says that we tend to suppress contradictory evidence. In this situation, there’s a tendency for the journey to reinforce existing emotions. That’s why the same form can be a non-issue for some and drive others crazy. Those who come in with a positive mindset tend to accept the form as something that must be done, while those who feel negatively see it as another example of how awful the company is.