When soliciting feedback from customers through formal surveys, we only receive a percentage of completed or returned surveys. This percentage (number of people who answered the survey divided by the number of people in the sample) is referred to as the response or completion rate. In practice, I have seen response rates as low as 10% and as high as 80% across a variety of different surveys and target populations (e.g., employee and customer). How important is the response rate?
I recently got my hands on free US government data on patient survey ratings for over 3800 US hospitals. The Federal government, specifically the Centers for Medicare & Medicaid Services (CMS) and the Agency for Healthcare Research and Quality (AHRQ) funded the development of this standardized patient survey – HCAHPS (Hospital Consumer Assessment of Healthcare Providers and Systems) – to publicly report the patient’s perspective of hospital care.
The HCAHPS data include a variety of data for each of the 3800 hospitals, including:
- Patient ratings: The reported data reflect patient ratings of their inpatient experience across 10 different areas, eight touch points (e.g., nurse communication, pain management) and two loyalty-related questions (e.g., overall quality rating and recommend). Scores on these metrics can range from 0 (low) to 100 (high) and reflect the percent of patients who provided “top box” ratings. For the current analysis, I created a Patient Advocacy Loyalty index by averaging the two loyalty-related questions. I also used the other eight customer experience ratings.
- Survey response rate: These data are reported as the simple response rate. I created five segments of hospitals based on their response rates. These five segments are: 1) 20% or less, 2) between 21% and 30%, 3) between 31% and 40%, 4) between 41% and 50% and 5) 51% or greater.
- Number of completed surveys: This variable is reported as one of three levels: 1) less than 100 completed surveys, 2) 100-299 completed surveys and 3) 300 or more completed surveys.
Results
The average survey response rate across all 3848 hospitals was .32. That is, for every 100 patients who are asked to complete the survey, 32 actually provide feedback.
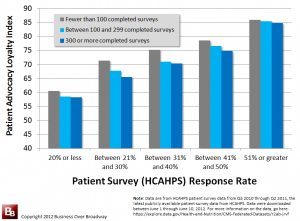
I compared patient advocacy ratings across the different levels of response rates and number of completed surveys. These analyses are visually depicted in Figure 1. As you can see, there are a couple of interesting findings:
- Number of completed surveys is slightly related (R² < .01) to patient loyalty. Hospitals that had less than 100 completed surveys had slightly higher patient loyalty scores than hospitals who had more than 100 completed surveys.
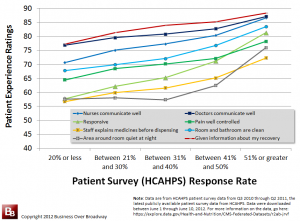
- Response rate was strongly related (R² = .32) to patient loyalty. Hospitals that had lower survey response rates had significantly and substantially lower patient advocacy ratings compared to hospitals with higher survey response rates. In fact, there is about a 25-point difference between hospitals with the lowest response rates (Patient Advocacy Loyalty ~ 60) and the highest response rates (Patient Advocacy Loyalty ~ 85). By the way, I found a similar pattern of results using the other patient experience metrics (see Figure 2); hospitals with lower response rates had patients who had poorer patient experiences compared to hospitals with higher response rates.
Why is there a relationship between survey response rate and survey ratings? PRC, a consulting firm that specializes in healthcare survey research, make the claim that response rates may cause rating differences. They hint that, to improve your patient ratings, you need to have a higher response rate. While the representativeness of the sample of survey respondents to the population is paramount to drawing conclusions about the population, I am skeptical that merely improving your response rate will increase your ratings.
Perhaps response rate is just another measure of the quality of the customer/patient relationship. The findings suggest that patients who are dissatisfied with their hospital experience are less likely to complete a survey. If true, hospitals with truly dissatisfied patients will have lower ratings and lower response rates.
Potential Problems with HCAHPS Data?
The HCAHPS data are collected by many different survey vendors (In fact, there are 44 approved survey vendors responsible for collecting the patient survey data) using three different data collection methods: 1) telephone only, 2) mail only and 3) mix mode (telephone and mail). There is some research that shows that methodological factors impact response rates. For example, two researchers found a higher patient survey response rate for face-to-face methods for recruitment (76.7%) or data collection (76.9%) compared to the mail method of recruitment (66.5%) or data collection (67%).
Using the HCAHPS patient ratings for hospital reimbursement purposes would require that differences across the various vendors/methods be minimal. It would be interesting (necessary?) to see if there are differences across 44 approved survey vendors and data collection methods with respect to the response rates, other survey process metrics and survey ratings. Understanding the reason behind the strong relationship between response rates and survey ratings is paramount to establishing the validity of the survey ratings.
Summary
Survey response rate was significantly and substantially related to survey ratings. Specifically, hospitals that had a higher survey response rate received higher patient ratings on their hospital experience. I will try to explore this issue in upcoming blog posts.
Large survey vendors may be in a good position to study the relationship between survey process measures (e.g., response rates) and survey ratings; these vendors have multiple accounts on which they have both types of metrics. It would be interesting to see if the current finding generalizes to other industries. Additionally, identifying the reasons behind the relationship between response rates and survey ratings would be essential to understanding the validity of the survey ratings.


