
The NPS is a popular organizational metric used by customer experience professionals. I have noted several problems with the NPS elsewhere (see Stop Listening to the NPS Dogma and Follow the Evidenced) related to the claim that the NPS is the best predictor of growth (research shows it is not) and the use of net scores (mean and top box scores are better summary metrics). In today’s post, I want to discuss another problem regarding the meaning of customers’ ratings and the subsequent customer segments based on those ratings.
NPS Methodology
The NPS is based on customers’ ratings of the question, “How likely are you to recommend us to your friends/colleagues?” Based on their rating (from 0 – not at all likely to 10 – extremely likely), customers are segmented into three groups: 1) Detractors (customers who give a rating of 0-6), 2) Passives (customers who give ratings of 7-8) and 3) Promoters (customers who give ratings of 9-10). A company (or group) can calculate its Net Promoter Score by simply subtracting the proportion of Detractors from the proportion of Promoters:
NPS = prop(Promoters) – prop(Detractors)
Meaning of NPS Segments
The goal of segmenting customers into three NPS groups is to create three homogeneous sets of customers. Promoters are likely to recommend your company. Passives are less likely to recommend. Detractors are the least likely to recommend. But how similar are customers within a given NPS segment to each other? To study this question, I explored the meaning of likelihood ratings by comparing two similar recommend questions.
The Data
Data are from a customer survey of a large automobile dealership located on the east coast. The current analysis is based on 30,236 respondents over a 4-year period (2010 thru Nov 2013) across 20 different locations. While the survey asked customers six questions, I used two for the current analysis:
How likely is it that you would recommend your sales person to a friend or colleague? Rating options were on a rating scale from 0 (Least Likely) to 10 (Most Likely).
Would you recommend your sales associate to a friend, relative or neighbor? Response options were either “Yes” or “No.”
These two questions essentially ask the same question, just using different response options. While the verbal anchors for the current likelihood rating scale were not the same verbal anchors traditionally used for the NPS (0 – not at all likely to 10 – Extremely likely), the current scale still provided a gradient rating of loyalty in which higher ratings represented higher levels of loyalty.
While higher ratings are better, we are still left with some ambiguity about what defines a “good” likelihood ratings. How much better is a score of 8 than 7? Is there a meaningful difference between a rating of 6 and 7? Answering these questions would provide some evidence about the quality of the NPS segments. To answer these questions, I compared responses to the two recommend questions. Specifically, I calculated the percent of “Yes” responses (question 2 above) for each of the 11 response options (question 1 above).
Results

There is no major difference between ratings of 8, 9 and 10 with respect to the percent of customers who say they would recommend. For each of the top likelihood scale values, nearly all (over 99%) customers say they would recommend.
Likelihood ratings of 0 through 6 represent negative loyalty responses; for each of these likelihood values, most customers would not recommend.
There is a substantial increase in loyalty from a likelihood rating of 6 (38% say “Yes”) to 7 (80% say “Yes”).
Summary and Implications
The current study examined the meaning of customer segments based on the NPS methodology. The Promoter-Passive-Detractor trichotomy of the NPS results in a couple of segments that are internally heterogeneous with respect to recommending behaviors. There are a couple of implications regarding the current study results.
First, companies use customer segmentation analysis to create homogeneous groups of customers to target each group with specific marketing, sales and service initiatives to improve or maintain overall customer loyalty. The Net Promoter Score segments customers into three groups based on their likelihood rating: Promoters (ratings of 9 or 10), Passives (ratings of 7 or 8) and Detractors (ratings of 0 through 6). The results of the present analysis, however, suggest a better segmentation, resulting in more homogeneous groups of customers. Customers who give a likelihood rating of 8 are more similar to customers who give a rating of 9 or 10 (Promoters) than they are to customers who give a rating of 7 (Passives).
Additionally, it appears that “Detractors” (customers who gave a rating of 0 through 6) are not created equal. While ratings of 0 through 6 do indicate low recommendation intentions (< 40% would recommend), there were differences across the different values; a likelihood rating of 5 or 6 is significantly more positive (32% would recommend) than the lower likelihood ratings (7% would recommend). Instead of targeting improvement initiatives at the entire set of NPS Detractors, these results suggest that it might be beneficial to personalize improvement initiatives across different at-risk customers. For example, moving customers from a likelihood rating from 0 to 1 or 1 to 2 does very little to increase recommendations (increase of 1 percentage point). Moving customers from a likelihood rating from 6 to 7, however, would result in a substantial increase in recommending (increase of 40 percentage points).
Second, the nomenclature to describe the three customer segments that is used by the NPS developers is problematic. The term, Detractors, is misleading. Low ratings on the "likelihood to recommend" question only indicates that those customers would not recommend the company; it does not mean they would disparage the company/brand. A better term to describe these customers is Non-Advocates. The relabeling of this group of customers as "Non-Advocates" more honestly reflects what is being measured by the "likelihood to recommend" question. See Word-of-Mouth Index that more fully explores this notion.
Better labels for the three segments would be:
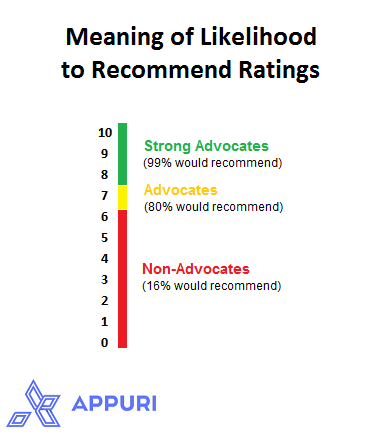
Strong Advocates: Customers who give a likelihood rating of 8, 9 or 10. Over 99% percent of Strong Advocates say they would recommend.
Advocates: Customers who give a likelihood rating of 7. About 80% of Advocates say they would recommend.
Non-Advocates: Customers who give a likelihood rating of 0 through 6. On average, 84% of Non-Advocates say they would not recommend. These customers are labeled Detractors in NPS lingo.
Segmenting customers into homogeneous groups helps improve how you manage customer relationships. The current study showed that the NPS trichotomy results in more heterogeneous groups with respect to Passives and Detractors. This type of mis-segmentation could lead to missed opportunities to improve customer loyalty simply because you are targeting the wrong customers in improvement initiatives. The study offered a better approach to customer segmentation based on the likelihood question that could help improve how you market to, sell to and service your customers.


Though I agree that a) the current (and historic, since 2003) trichotomy approach NPS applies is, as you’ve labeled it, ‘mis-segmentation’ with many analytical and application flaws, and b) your approach is both more aptly labeled and more actionable, some concerns still exist.
Recommendation level as a surrogate for advocacy level is incomplete. Having co-developed a research framework to define and analyze advocacy level in 2004, the approach we created included consideration set and level of brand commitment, purchase history and planned future purchase, and evidence/level of positive and negative word-of-mouth on behalf of the brand. We actually found, again and again, that, except at the very highest levels of advocacy, recommendation had very little to do affinity toward and commitment to the brand. My 2010 post on this subject has been viewed over 3,000 times, and I’ve written an entire book addressing the meaning and measurement of customer advocacy at the most positive pole of brand commitment and customer sabotage at the most negative pole