
In my last column “Starter Kit for Customer Experience Data Analytics” I posed four issues that you ought to consider when undertaking “Big Data” or any other sort of analytics, and covered the first two:
- “Where do I start?”
- “Do I need “Big Data” and, if so, what the heck is it?”
- “We have solid spreadsheet junkies but do I also need “data scientists” and, if so, where can I get them?”
- “How can I track progress?”
In this column I’ll focus on the last two issues and suggest 3 tips for Customer Experience Analytics.
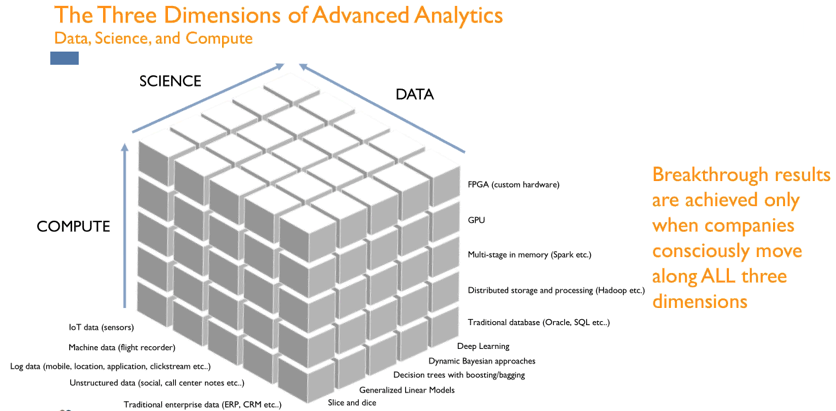
Returning now to the last two issues about “data scientists” and tracking progress with analytics, it’s instructive to consider the three axes of “Big Data” shown in this cube, Compute + Data + Science. Most companies do a whole lot of data collection and reporting by function (financial forecasting, pricing methods at the SKU level, reason codes, etc), many still using spreadsheets with pivot tables and some with linear program models or conjoint analysis. But few have plumbed how much is now available across these three axes, and as noted the best results require a coordinated attack along all three of the dimensions.
For example, if you need to move from unstructured data analysis to logged data or machine data, you have to match the compute axis and science axis beyond the simpler steps. This is where “Big Data” and data scientists become critically important.
Big Data allows you to mash up different data sources, query them, test them, and produce a stronger solution than single-threaded approaches.
We’re not just talking about real time versus batched processing, but you might think about how hard it is to collect and act in (near) real time, e.g. if your customers are expressing their deep upset at a retail branch or to a contact center rep, can you detect it during that conversation and offer up an alternative that has proven to be a good remedy with similar customers? If not, you’re operating – at best – in a batched mode and that’s way too late in this era when customers can walk away so fast and not tell you that they’re leaving. But they are signaling, so we’re talking about reading acting upon those signals.
A good article in HBR describes what data scientists do, focusing on LinkedIn’s experiences.
“More than anything, what data scientists do is make discoveries while swimming in data. It’s their preferred method of navigating the world around them. At ease in the digital realm, they are able to bring structure to large quantities of formless data and make analysis possible. They identify rich data sources, join them with other, potentially incomplete data sources, and clean the resulting set. In a competitive landscape where challenges keep changing and data never stop flowing, data scientists help decision makers shift from ad hoc analysis to an ongoing conversation with data.”1
These data scientists usually have advanced degrees in statistics, modeling, and related fields:
“Data science was developed to handle the flood of big data engulfing the world. A blend of statisticians, computer scientists and creative thinkers, data scientists have the:
- Skills to collect, process and extract value from giant and diverse data sets
- Imagination to understand, visualize and communicate their findings to non-data scientists
- Ability to create data-driven solutions that boost profits, reduce costs and even help save the world
Data scientists work in every industry – from the Defense Department to Internet start-ups to financial institutions – and tackle big data projects on every level.”2
Now let’s turn to the 4th issue “How can I track progress?” This issue hinges on the core business questions that you’re trying to solve, like this short list that I proposed in my earlier column:
“How can we create an awesome customer experience across all of the touch points that we offer, and that our customers use to contact us?” (The “omni-channel” dilemma)
“How can we hold onto our best performers?” (So-called “best agents” and “best customers”)
“Why has our NPS declined, and what can we do to be better than Amazon?”
Each of these questions and other vexing ones are in by two books, Best Service3 and Your Customer Rules! (Me2B)4 It’s essential to have them as your starting points, and then tracking progress is relatively easy from a data analytics perspective (e.g. for “How can we hold onto our best performers?” you can report on the percentage of “top customer service agents”, usually 15% of those who can create great customer experiences while being productive, that you are able to keep 6 months and onwards – See my other column “Using Big Data to Retain Your Best Agents and Create an Energized Workforce”).
The challenge is collecting, reporting, and taking action on these key questions in (near) real time; as my earlier example suggested, this is the “new normal” and it requires more sophisticated tracking, interventions, and machine learning building on commercial visualization and BI tools like Tableau or QlikView, or the newer open source solutions. This, too, is the province of Big Data and data scientists.
By now you might have figured out the “3 Tips for Customer Experience Analytics” but here they are:
1. Start with the right business questions, the ones stalling your top line growth or forcing down sustained profits, and/or frustrating your clients and customers. Extract these questions from customer surveys, contact center recordings, social media or chat threads, and other channels using speech or text analysis or, from inspecting the customer journey using experiential analyses (see my earlier column “Don’t Ask, Know! What Are Your Customers Not Saying? Not Doing?”) Socialize this list of potential core questions with your customer-facing teams, not just account managers but also contact center agents (what I’ve always called WOCAS = What Our Customers Are Saying, first introduced in a column I wrote 10 years ago “Premier Support Programs: All Customers Aren’t Equal” and later in my 1st book on Best Service3).
2. Collect, mash up, analyze, and report data shedding light on these questions using the powerful insights of Big Data, and data scientists. Your data will come from the same sources in the 1st insight, both unstructured and structured data, but also from potentially far-flung places like employee attendance records, customer purchase rates after they had to contact technical support, and weather data affecting performance or sales. The key here is “mashing up” these data into tools and models that Big Data handles, with iterative modeling that explore possible solutions. One of our recent client projects required 77 runs of the models, not just one model but several ones that eventually produced high confidence levels that the data “fit” to effect changes in core processes.
3. Stress test the results in (near) real time to ensure that they still work. This might seem obvious but it’s reinforces the “evergreen” nature in any analytical pursuit, in any managerial one too. Every input and variable is constantly in flux — customer needs, competitive dynamics, products and processes, and more – so solutions you thought were in shape yesterday will be out of date tomorrow, maybe even today. Analytical leaders constantly stress test results, not just “A/B testing” but more like “A to Z testing”, and they analyze minute changes to be able to respond immediately to changes, and to anticipate those changes. Some even follow my former McKinsey colleague Tom Peters always espoused: “Even if it’s not broken, break it!” before your competitors break it, or “If It Ain’t Broke, Fix It Anyway”5
1 “Data Scientist: The Sexiest Job of the 21st Century”, Thomas Davenport and D.J Patil, https://hbr.org/2012/10/data-scientist-the-sexiest-job-of-the-21st-century , accessed 15 November 2016
2 http://www.mastersindatascience.org, accessed 15 November 2016
3 The Best Service is No Service: How to Liberate Your Customers From Customer Service, Keep Them Happy, and Control Costs Bill Price & David Jaffe (Wiley 2008). Based partly on my years as Amazon’s 1st Worldwide VP of Customer Service, but also on “Best Service” providers around the world who have made it easier for their customers to do business with them, we proposed 7 Drivers that start with “Challenge demand for service”:
1. “Eliminate dumb contacts”
2. “Create engaging self-service”
3. “Be proactive”
4. “Make it really easy to contact your company”
5. “Own the actions across the company”
6. “Listen and act”
7. “Deliver great service experiences”
4 Your Customer Rules! Delivering the Me2B Experiences That Today’s Customers Demand , Bill Price & David Jaffe (Wiley 2015). Based on original research into 12 recognized CX leaders there are the 7 Customer Needs that produce a winning “Me2B” culture, with a total of 39 sub-needs:
1. “You know me, you remember me”
2. “You give me choices”
3. “You make it easy for me”
4. “You value me”
5. “You trust me”
6. “You surprise me with stuff that I can’t imagine”
7. “You help me do better, you help me do more”
5 http://articles.latimes.com/1987-10-11/books/bk-13230_1_peters-and-waterman-tom-peters-bantam-books , accessed 15 November 2016


