
My family splits our grocery shopping budget between three stores. Trader Joe’s is our favorite. We like the selection, pricing, and interaction with employees who genuinely seem to enjoy working there and helping customers. A great experience overall.
Why don’t we spend all our money there? In a word, convenience. Trader Joe’s is a 15-minute drive away, so we make the trip every week or two to stock up. Other shopping is done at an Albertsons and a small specialty store, both walking distance from our condo.
If I received a survey from all three stores, I would tell Trader Joe’s to open a store nearby, Albertsons to update its tired store design, and the small store to carry a bigger selection. However, unless the new Trader Joe’s was within walking distance, it wouldn’t change our spending. Likewise, Albertsons could invest in a nicer store but it wouldn’t change how much we buy there, because convenience is most important so long as Trader Joe’s requires a drive.
And the small store? We enjoy shopping there because it’s small. Kind of like a mini Trader Joe’s. Getting bigger wouldn’t necessarily help, unless they became, well, Trader Joe’s — carrying a larger selection, hiring and training employees, etc. That’s not going to happen.
Customer Experience to the Rescue?
In the past few years there’s been a groundswell of support for improving the Customer Experience (CX) and investing in Customer Experience Management (CXM) programs. After all, providing a “better” CX is correlated with better stock performance.
The approach to success, therefore, is easy:
- Ask your customers what they want
- Give them more of that
- Watch the stock price soar!
As my grocery shopping example illustrates, it’s not quite that simple. On the one hand I’m a huge supporter of the CX movement, because it has brought an outside-in approach to looking at customer relationships. Something CRM failed to do.
But I also have a queasy feeling that a few years from now, business leaders who invested in voice of customer (VoC) programs, journey mapping, omni-channel systems and so on, will wake up to the reality that after “improving” CX as customers requested, the business did not see a change in customer behavior. You know, like spending more money.
Think it can’t happen? Then consider Walmart’s “$1.85 billion mistake” what some experts say the retailing giant lost in an ill-conceived “Project Impact” to reduce inventory. The initiative was a well-intended response to customer feedback criticizing clutter in the stores.
The unhappy result, after spending millions of dollars in store refurbishment, was a decline in same-store sales. You see, while some customers complained about clutter, it was Walmart’s broad selection and low prices that brought them back to shop, again and again.
The Metric is Not the Answer
I’ve always advocated investing in the research required to find the right loyalty metric for your business, rather than blindly adopting one that is easy or popular, be it CSAT, NPS, or the recently trendy CES (Customer Effort Score).
Yet my most recent study of customer-centric success factors finds no difference in the use of metrics between business performance Leaders and Laggards. Both groups use a mix of metrics (only 5% use just “one number”). What Leaders appear to do differently is act more effectively on the feedback they receive.
And that action has to be in the context of a business goal. If growing share of wallet is important, then the Wallet Allocation Rule could help, described here by Tim Keiningham, coauthor of a book by the same name:
It’s not your score that matters. It’s all about your rank. In other words, do customers perceive your brand as better, the same, or worse than competing brands they also use? It turns out that by simply knowing your brand’s rank and the number of competing brands a customer also uses, managers can now accurately predict share of wallet using a simple formula, called the Wallet Allocation Rule:The Wallet Allocation Rule

I followed up with Tim to ask a series of questions about Wallet Allocation Rule. With minor edits for clarity and space, here is our conversation.
Bob Thompson:
You use the term “Customer Experience” and yet there is some debate about what exactly it means. Is CX just about interactions, or has it become, as the CXM practitioners contend, another term for “customer loyalty” encompassing every interaction, thought or feeling a consumer has about a brand — including people, systems, products, pricing>
Tim Keiningham:
I am actually working on a scientific paper with some academics to answer this very question. I am using the term loosely here. In the context of this discussion, I am referring to customers’ overall perceptions of the brands that customers use in a category.
Bob Thompson:
My research finds that business performance leaders use a mix of metrics (CSAT, NPS and others) about the same way as performance laggards. What differentiates leaders vs. laggards seems to be a bias for action – closing the loop on feedback – not precision in metrics. Given the above, what is it that the Wallet Allocation Rule enables business leaders to do differently that will help them outperform their rivals?
Tim Keiningham:
Without question, a “bias for action” is required for any firm to be successful. That is why you will always see a clear dividing line between winners and losers based upon their commitment to action. But the fact that something is “necessary” for success doesn’t make it “sufficient.” There are lots of examples where companies were willing to act, but their actions led to hard times…or even worse, real disaster. Homebanc, The Wallace Company, and a host of others broke but beloved companies are proof that focusing on the wrong things—even when they result in higher satisfaction or Net Promoter Score (NPS) levels—isn’t fixed by earnest effort.
Instead we need to focus on the “right” things. And by “right” I mean things that have a meaningful impact in how customers divide their spending among firms/brands in an industry category. Currently ALL commonly used satisfaction and loyalty metrics to a terrible job of linking to the share of spending that customers allocate to the brands they use in a category (aka “share of wallet”). In fact, our research finds that changes in satisfaction or NPS explain less than one-half of one percent of changes in customers’ share of wallet allocations.
Bob Thompson:
How should metrics be used?
Tim Keiningham:
Before we can accurately identify “what” to do, we first need to make certain that our metrics actually link to customers’ spending behaviors. Through our research we discovered that the primary problem isn’t the metrics themselves. Rather, it is the way these metrics are measured and analyzed.
Managers know that satisfaction is relative to competitive alternatives. But that isn’t how we actually measure the experience. Satisfaction (and Net Promoter Score) levels are almost always determined based on customers’ ratings of your brand alone. For example, most managers consider a rating of “9” (where “10” is the best) to be a good score. Using the Net Promoter Score, customers who rate your brand a 9 or 10 are considered Promoters, which is the goal of the approach. The problem is that our research finds if a customer is a Promoter for your brand and also uses one or more competing brands, 80 percent of the time the customer is also a Promoter for the competition—and frequently the competitor is rated higher despite the customer being classified as a Promoter for both organizations. Clearly, a system that cannot distinguish winners from ties and losers has major flaws.
Our research has found a very simple solution to this problem. Instead of focusing on a customer’s absolute satisfaction (or NPS) level, focus instead on the relative rank that this satisfaction level represents vis-à-vis the competitors the customer also uses. Our research found a very simple formula—the Wallet Allocation Rule—that can easily use “rank” in conjunction with the “number of brands” used by the customer to predict the share of wallet.
Bob Thompson:
How does traditional customer loyalty driver analysis lead managers astray?
Tim Keiningham:
Managers have traditionally relied on key driver analysis to guide them about the most important issues affecting customer satisfaction (or Net Promoter Score). Traditional driver analyses examine the relationship between customers’ satisfaction with specific attributes of the service experience and their
overall satisfaction levels.
Traditional driver analyses, however, will not work with the Wallet Allocation Rule. With the Wallet Allocation Rule, satisfaction is not measured in a vacuum. What’s important here is the rank of a brand’s satisfaction level compared with that of its competitors. Specifically, overall satisfaction ratings for all brands that a customer uses are required in order to establish the proper context.
As a result, to understand the drivers of rank, the attributes of the service experience must be determined in relation to the competition. This represents a major departure from traditional driver approaches. More important, it has serious implications for identifying where companies should focus their scarce resources to improve the customer experience. That’s because it turns out that what drives share isn’t what drives satisfaction or NPS.
The traditional satisfaction and NPS approach for identifying opportunities can be thought of as trying to find the answer to the question, “What can we do to make you happier?” Whether it is analyzing customers’ open-end survey responses, or deriving importance through statistical analysis, the focus is virtually always on improving satisfaction with what the firm/brand currently offers.
Performance, however, is relative to competitive alternatives. Improving satisfaction is important because, at some point, increases in satisfaction make a brand more attractive to customers relative to competitors. But that is not enough. Managers also need understand exactly why customers use each of the brands that they do. Customers have legitimate reasons for using multiple brands in a category. Therefore efforts designed to improve share of wallet that do not address precisely why your customers also use your competitors are doomed.
One of the most common reasons customers use multiple brands is because they perceive there to be unique benefits associated with each brand they use. For example, credit union and retail bank managers often find that customers use one institution because of lower fees and another because of better Internet banking services. Therefore, reducing fees further for the fee-differentiated institution will not likely prove to be the best opportunity to improve share of deposits, even though low fees are the strongest driver of the institution’s customers’ satisfaction and loyalty. The competition is being used for another reason.
With an understanding of why your customers use your brand as well as competitive brands, you can identify what it really takes to be the first choice of their customers. And because the Wallet Allocation Rule is tied to share of wallet, managers can prioritize their efforts by their potential impact on future revenues.
Bob Thompson:
In your recent webinar you noted that 2014 was a year when ACSI trends didn’t match stock market performance. Aside from that year, the ASCI has been validated as a predictor of business success, so why can’t CSAT can’t be considered a viable metric?
Tim Keiningham:
The first thing I want to note is that we were reporting on the Bloomberg Businessweek analysis of the relationship between the ACSI and stock market performance, which resulted in the article “Proof That It Pays to Be America’s Most-Hated Companies.” This wouldn’t pass muster at a scientific journal, and it wasn’t designed to do so. What it did was point out the difficulty linking customer satisfaction and stock market performance.
There have been a number of scientific investigations reported in the best scientific journals that show a statistically significant positive relationship between the American Customer Satisfaction Index (ACSI) and stock market returns. In fact, I co-authored one such paper that appeared in the Journal of Marketing. Moreover, I am co-author on another rigorous investigation into the relationship between the ACSI, loyalty intentions, and stock market performance that will likely find its way into a prestigious scientific journal.
Clearly, we aren’t saying that satisfaction isn’t important—of course it is. We all want satisfied customers who recommend the brand. Moreover the ACSI is the premier barometer of national satisfaction levels. That said, it is a big stretch going to a general statement like “satisfaction is good” to “a focus on satisfaction will result in better market performance.”
With regard to the ACSI and stock performance, there are several things to note.
- The scientific research varies widely regarding whether or not the ACSI actually predicts stock market performance (over and above standard financial models). In fact, the inconsistency of findings is one of the reasons for my co-authors’ and my current investigation.
- It takes VERY sophisticated analyses to find a positive relationship between satisfaction and stock market performance (even when one can be found). It is far more involved than most firms are capable of conducting. In a nutshell, this means that the relationship is far from obvious. Moreover, when it is found, it isn’t particularly strong.
- Our current research finds that the relationship between satisfaction and stock market performance is affected by a number of factors, such as the industry in which the firm operates. Moreover, it is far from a sure thing that higher satisfaction will lead to higher market performance for any individual firm.
- The ACSI is a firm-level metric (as opposed to a customer-level metric). If you want to identify what drives share of wallet, this MUST be done at the customer level. Our current analysis finds that the prior scientific research (including my own) has over-estimated the aggregated insights from satisfaction on shareholder value for some types of firms, and are therefore less (or not) applicable at the individual customer level.
However, there is good news. The Wallet Allocation Rule works with satisfaction, recommend intention, NPS classifications (i.e. Promoter, Passive, Detractor), and the other most commonly used customer loyalty metrics. So there is no need to throw out what firms are currently doing. They simply need to put these metrics in a relative framework to determine their brand’s relative rank vis-à-vis competing brands that the customer is also using.
Bob Thompson:
In your webinar, your examples implied that “delight” is about giving away products below cost or providing costly guarantees. So are you saying, like the HBR article of a few years ago, that delight doesn’t matter in customer loyalty?
Tim Keiningham:
We are most definitely NOT saying that customer delight doesn’t matter in customer loyalty. In fact, I am also working with another group of academics on research specifically focused on the topic of customer delight. Delight clearly matters, and we as managers need to do a much better job of understanding what creates delight, and how efforts to delight customers can become more manageable (as opposed to ad hoc) aspects of the customer experience.
In response specifically to your question, in the webinar I referred to “Money Losing Delighters” as a way to frame the problem that satisfaction and price are negatively correlated to one another in most industries. In other words, the easiest way to increase satisfaction levels is to drop prices. In fact, you can delight customers by giving away your products–for as long as you remain in business.
Of course, that isn’t news. And it’s obviously a bad business decision. But sometimes the only way to point to the fallacy of a strategy is to show what happens at the extreme condition.
The HBR article to which you refer argues that customers don’t want to be delighted, they just want the experience to be as easy as possible. The research from which this conclusion was drawn came from call center experiences. This may actually be true in a call center situation where typically customers are calling regarding a problem and they want it solved as easily as possible. An important thing to note is that this research is also “transaction-specific”–in other words, it does not reflect customers’ overall perceptions of the brand.
Bob Thompson:
If solving customer problems is not enough to drive loyalty, what is?
Tim Keiningham:
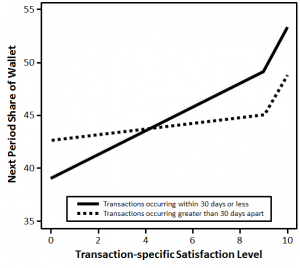
Simply not having problems is not how customer loyalty is built over time (at least for most customers in most industries). Instead, research I co-authored into how satisfaction with each transaction impacts customers’ future share of category spending—to date the only peer reviewed scientific research on the topic points to very serious issue with the focusing only on problem solving: Lower scores don’t have a greater impact on share of wallet—higher scores do (see Figure).[1]
This is the exact opposite of what managers have been led to believe (and the HBR article advocates). Consultants typically report disastrous consequences of dissatisfactory experiences. And that might be true if most of our experiences with a company were Kafkaesque exchanges. But that isn’t the case for the overwhelming majority of companies. They would be out of business if it was.
Instead, most transaction-specific dissatisfactory experiences are anomalies, and customers know that. Customers are far more forgiving of occasional lapses than managers tend to believe.
Why? It is basic psychology. Emotional intensity fades much faster for negative events than for positive ones. [2] Thank goodness for that, otherwise we would be miserable most of the time. The end result is that customers are seldom “gone for good” over a single dissatisfactory experience.[3] Moreover, they tend to remember the positive when thinking about their overall experience.
Bob Thompson:
Has the Wallet Allocation Rule been validated as truly predictive of improvements in business performance, not just a simple correlation?
Tim Keiningham:
The first thing to note is that the Wallet Allocation Rule is a function of Zipf’s Law. It’s just an easy way for managers to apply it. We at Ipsos have been using Zipf’s Law as a cornerstone of our brand equity and customer loyalty products for years–literally the biggest brands in the world use it because it works at growing share of wallet (i.e. share of category spending).
We also have subjected our work to large scale scientific investigations. Perhaps the most important of these to your question is a large scale study that is forthcoming in the next issue of the Journal of Service Management (a peer reviewed scientific journal), where we look at changes in the Wallet Allocation Rule vs. changes in share of wallet. The Wallet Allocation Rule works, whereas absolute satisfaction and NPS do a terrible job.
Bob Thompson:
Given that Wallet Allocation Rule needs to be calculated at the individual level, is there an opportunity for marketers to use it for 1:1 marketing?
Tim Keiningham:
Yes. While it’s unlikely that companies can get a 100% survey response rate to calculate an WAR score for all of them, what they can do is identify customers who look and behave similarly and assign an estimated WAR score to them (similar to what is proposed in this Journal of Marketing paper). The key is also identifying the segment specific drivers of rank (at the most detailed/smallest level possible) to make the 1-to-1 marketing activities effective.
Bob Thompson:
Can you give an example where a company using Wallet Allocation Rule helped executives make better decisions that changed customer spending?
Tim Keiningham:
The grocery retail industry in Brazil is a mixture of large national or international chains that compete with many small localized chains, as well as one or two outlet shops. Because of their size, the largest supermarkets are able to serve broader customer needs than just grocery shopping. For example, in addition to groceries, larger retailers may also offer services, such as pharmacy, tobacco shop, lottery, gasoline, bill-pay stations for utilities, and mobile phone payment.
As a result, large chains such as Extra, Carrefour Hyper, Walmart, and Dia represent formidable challengers to smaller grocery retailers such as Cooperative de Consumo (known as Coop). Coop has 28 stores in 10 cities around São Paulo in Brazil. It has more than 1.5 million “cooperative members” (that receive special discounts and other benefits from being part of a consumer cooperative).
Relative to other, larger grocery retailers, Coop receives high customer satisfaction ratings. The problem, however, is that high satisfaction does not translate into high behavioral loyalty among its customers. Coop’s customers overwhelmingly divide their grocery spending among multiple grocery retailers. In fact, 77% of Coop’s customers use at least one other grocer, and 40% shop at two or more competitors. The end result of this divided loyalty is that 45% of every Coop customer’s spending on groceries goes to a competitor.
An examination of the drivers of Coop’s satisfaction revealed that the top four drivers of satisfaction are 1) price, 2) the pharmacy (every Coop store has one), 3) the variety and quality of items, and 4) the membership in the Coop. Of course, price is often one of the most important drivers of satisfaction. Moreover, there is no doubt that if Coop could significantly drop prices, price sensitive customers would buy more from Coop. As a small cooperative grocery retailer, however, Coop has little room for additional price concession.
Using the Wallet Allocation Rule approach to determine precisely why customers feel the need to use competitors (i.e., what drives share of wallet), the most important reason turns out to be the ambiance and cleanliness of the stores (specifically the store layout and hygiene). This issue does not even make it into the top six drivers of satisfaction!

Timothy Keiningham, Ph.D., is Global Chief Strategy Officer and Executive Vice President of IPSOS, and coauthor of The Wallet Allocation Rule.
I asked for reactions from industry experts. Bob Hayes and Michael Lowenstein are both members of CustomerThink’s prestigious Advisors council and seasoned practitioners in customer loyalty. Here’s what they had to say about Wallet Allocation Rule.
Bob Hayes, Founder of Business Over Broadway:
From what I gather from this wallet allocation rule, I would agree that satisfaction is not enough to understand growth. I wrote about his rule a few years ago when I developed a question that determines your company’s ranking. Even in my research I found that advocacy loyalty (e.g., satisfaction, recommend) is weakly related to purchasing loyalty (buy more from company, buy different products).
The relative performance assessment question (e.g., your ranking) predicted purchasing loyalty above what satisfaction with CX accounted for. The claim that satisfaction only accounts for 1% of the variance is rather low given that both measures are derived from self-report measures.
Michael Lowenstein, Thought Leader Principal with Beyond Philosophy:
Tim and I are in complete agreement regarding NPS and satisfaction. His findings and mine closely parallel, and the array of academic and professional studies I’ve reviewed and archived are clear that neither the recommendation question, especially as configured in NPS, and ACSI-based satisfaction, which is superficial, tactical, and attitudinal, correlate with consumer category or brand spend share.
What Tim and his colleagues have done is to put a new spin, or variation, on rank ordering, fused with core idea of constant sum allocation of brand spend. Instead of brand spend, they have combined rank with total number of brands in the consumer’s set. Correlation, according to Tim’s research, is between .8 and .9,, compared to .1 for change in satisfaction or intention to recommend and share of wallet. What I’m looking to see is further proof that there’s true and consistent causation beyond the correlation data.
Simple Doesn’t Mean Easy
My take is that the Wallet Allocation Rule, while not a completely new idea, is an important development in the field of customer loyalty research. The “rule” has a solid foundation in peer-reviewed research, and Tim has been very forthcoming in answering detailed questions in this forum and others. The same cannot be said for Fred Reichheld when I attempted to interview him a few years ago about NPS.
That said, while the idea is simple, execution is not. Companies need to capture more data from consumers who are already overloaded with survey requests. And I wonder just how honest consumers will be in their spending habits — if they are willing to share them at all.
Another approach that has gained traction in recent years is simply to analyze what consumers actually do. Using “big data” analytics, companies can figure out how certain factors influence behavior, and change dynamically. Consumers can lie (to researchers and themselves) but behavior doesn’t.
Still, I applaud this effort to dig deeper into what really motivates customers to spend their money. Use of the Wallet Allocation Rule could force some companies to come to grips with an uncomfortable truth — improving customer service won’t change their customers spending patterns, while cutting prices will. Or, it may stimulate creative strategies that focus on share-of-wallet drivers without undermining the core business strategy.
In short, getting better insight about what drives customers loyalty is a Good Thing. But you still have to do something to turn that insight into a competitive advantage.
Notes:
1. Keiningham, Timothy L., Lerzan Aksoy, Edward C. Malthouse, Alexander Buoye, Bart Larivière (2014), “The Cumulative Effect of Satisfaction with Discrete Transactions on Share of Wallet,” Journal of Service Management. vol. 25, no. 3, p. 322: Figure 2.
2. Bower, Gordon H., and Stephen G. Gilligan (1979), “Remembering Information Related to One’s Self,” Journal of Research in Personality,13 (4), 420-432; Holmes, David S. (1970), “Differential Change in Affective Intensity and the Forgetting of Unpleasant Personal Experiences,”Journal of Personality and Social Psychology, 15 (3), 234-239; Matlin, Margaret W., and David Stang (1978),The Pollyanna Principle. Cambridge, MA: Schenkman; Robinson, John A. (1980), “Affect and retrieval of personal memories,” Motivation and Emotion, 4 (2), 149-174; Taylor, Shelley E. (1991), “Asymmetrical effects of positive and negative events: The mobilization-minimization hypothesis,” Psychological Bulletin, 110 (1), 67-85; Wagenaar, Willem A. (1986), “My memory: a study of autobiographical memory over six years,” Cognitive Psychology, 18 (2), 225-252; Walker, W. Richard, Rodney J. Vogl, and Charles P. Thompson (1997), “Autobiographical memory: Unpleasantness fades faster than pleasantness over time,” Applied Cognitive Psychology, 11 (5), 399-413.
3. Rust, Roland T., Valarie A. Zeithaml, and Katherine N. Lemon (2001), Driving customer equity: How customer lifetime value is reshaping corporate strategy. New York, NY: Simon and Schuster, pp. 36-37.


This is a really useful summary of the Wallet Allocation Rule, opening needed skylights onto antecedent measures which have actionability challenges. Bain and Satmetrix have endeavored to institutionalize NPS within companies using it as a core metric. They are walking down and backing away from claims like “it’s the one number you need to grow” your business, per Reichheld’s original HBR article from twelve years ago (https://hbr.org/2003/12/the-one-number-you-need-to-grow). When there is valid science on your side, hyperbole and puffery, and annexation of more valid approaches to understanding brand-related customer decision-making behaviors (such as equating recommendation with advocacy and brand bonding), aren’t necessary.
I would like to begin by thanking Bob Thompson for his detailed and insightful questions regarding The Wallet Allocation Rule. And I am delighted that he asked Bob Hayes and Michael Lowenstein to provide their insights as well. I hold Bob T., Bob H., and Michael in very high regard, as they have made and continue to make major contributions to the advancement of this field which we love dearly.
I would like to add a few short comments related to the thoughts shared by Bob Hayes and Bob Thompson.
Bob Hayes notes: “The claim that satisfaction only accounts for 1% of the variance is rather low given that both measures are derived from self-report measures.”
Without question, it is VERY low. In fact, we were shocked by this. Our examination of numerous firms (across countries and industries), however, finds that this is the most typical percentage of variance explained for any firm—in other words, it’s what a manager will most typically find for his/her firm.
My co-authors and I, however, do not speak with the voice of God. Rather, we implore readers of The Wallet Allocation Rule in several places in the book, “Please don’t take our word for it—prove it for yourself using simple spreadsheet software.” Fortunately, this is very easy to do (as we show in the figure in this article, which comes directly from the book: https://www.linkedin.com/pulse/how-really-grow-share-timothy-keiningham). If the results for any reader’s firm exceeds 10%, please let me know—seriously, as I have never seen it. It is almost always less than 5%, typically 1% in my observations. As we say in the book, this is “Oh My God! Bad”.
Bob Thompson notes, “Another approach that has gained traction in recent years is simply to analyze what consumers actually do. Using “big data” analytics, companies can figure out how certain factors influence behavior, and change dynamically. Consumers can lie (to researchers and themselves) but behavior doesn’t.”
My co-authors and I are BIG believers in the power that can come from harnessing customers’ behavioral data. But it’s a mistake for readers to conclude that this negates the need for market research. To quote from “Finding a Place for Market Research in a Big Data, Tech-enabled World,” which appeared in Knowledge@Wharton (http://knowledge.wharton.upenn.edu/article/finding-place-market-research-big-data-tech-enabled-world-2/), “Unprecedented access to big data does nothing to negate the need for deep market research, according to Wharton marketing professor Eric T. Bradlow, who along with Fader directs the Wharton Customer Analytics Initiative. “Can you possibly predict what people are going to do?” he asks. “Yes, you can. However, the science of psychology — why people are doing what they are doing — in traditional marketing research provides a great complement to what can be measured.”
There is also one thing that I would like to add with regard to use of the Wallet Allocation Rule. It is NOT a panacea. To quote Michael Lowenstein in his comment to this article, “When there is valid science on your side, hyperbole and puffery, and annexation of more valid approaches to understanding brand-related customer decision-making behaviors (such as equating recommendation with advocacy and brand bonding), aren’t necessary.”
You will never hear me or my co-authors say “just boost your rank” and everything will be fine. In fact, we explicitly say exactly the opposite. Specifically, we write:
“Although the Wallet Allocation Rule makes it possible to strongly link satisfaction (and other commonly used loyalty metrics) to share of wallet, greater share of wallet is not a panacea. Managers must make sure that efforts to improve a brand’s rank will result in not just greater share of wallet, but also in a positive return on investment.”
Finally, I want to concur with Bob Thompson that “simple doesn’t mean easy.” (Knowing the work of Michael Lowenstein and Bob Hayes, I am certain that they concur as well.) As we note at the end of one of the chapters in the book:
“The metrics presented here can help you identify and leverage real opportunities to improve customers’ share of spending with their brands. This won’t make the job of being a manager any easier—you still have to make the hard decisions about what to do to leverage these opportunities. But these metrics will allow you to make smarter decisions—ones that really impact growth!”
Cool. It is simple and effective.
Ranking of course can be done from figuring out where a customer buys, or how he values the various alternatives
Excellent article, Bob and Tim. I’ve read Tim’s book, and I believe the WAR methodology can help companies. I recommend the book for everyone who wants to see financial results from customer experience management.
Additionally, I’d like to elaborate on Tim’s point: “Simply not having problems is not how customer loyalty is built over time.” The follow-on commentary focused on resolving problems and the costs associated with that. It’s essential for companies to align with customers such that “not having problems” means preventing problems.
Some weaknesses I see in common practice today include the following:
1) Over-focus on ratings/indexes at the expense of digesting customer comments, which can help managers be truly outside-in oriented, to anticipate customers’ perceptions, and therefore, can empower managers to get things right the first time in design, execution and messaging..
2) Assuming that customer-centric means doing everything suggested by customers. It pays to conduct root cause analysis within the framework of customers’ jobs-to-be-done in order to properly frame customers’ suggestions for operational execution. It doesn’t mean being all things to all customers, or even to a single customer, in certain ways — but rather, being excellent at helping your most important target customers achieve capabilities most important to them.
3) Over-focus on micro actions at the expense of systemic prevention of issue recurrence.
4) Over-focus on correlations between lagging indicators at the expense of empowering internal transformation through an emphasis on leading indicators.
5) Over-focus on enticing customers to rebuy or recommend, and over-spending on the same, in lieu of making customer-centered management a way of life, with the same kind of across-the-board application as financial accountability and human resources stewardship that every manager accepts inherently.
I believe there’s no silver bullet for the business results — at a sustainable level — we seek from customer experience management: it must be a combination of the things Tim and his co-authors recommend, along with the things listed above as fundamental aspects of the quest for profitable customer experience excellence.
Tim — a question for you about the misfit of customers’ ratings with what plays out in behavior and financials.
Have you ever come across a study where the questions were rephrased such as:
How well did X contribute to what you were trying to do? or
How easy was it for you to get what you needed?
Essentially, I think our whole survey approach asks customers to judge us. In some cases we almost assume they can step into our shoes as supervisors or subject matter experts to judge us. I think this burden is too much — what’s in it for them to take on these judgments? I believe this is one of the reasons for low response rates and respondent fatigue.
What I believe would work best is to ask customers to judge things within the context of what they’re trying to get out of the product or relationship or interaction. I think another thing that’s important to customers is ease-of-doing business — on a more holistic level than the typical touchpoints. (By the way, I presented to the Marketing Research Association about this concept in 2011: Why Customer Satisfaction Surveys Aren’t Customer-Centric
Has there been much experimentation in these ways?
Lynn