
Being an unusually warm Super Bowl Sunday, the citizens of the tiny town of Bentonville, Arkansas were out and about before the big game.
My daughters (9 and 11), always scheming for a way to score a buck or two, took advantage of the weather and downtown foot traffic to set up a lemonade stand. The venture took off immediately, requiring the youngest to produce more product and the oldest to eventually get more lemons.
While working together unusually well, I did hear grumblings from both sides on the inadequacy of their performances or the perceived in-balance of the workload. I generally try not to play referee but hearing from both sides I could understand their views. Afterall, you only see what you do not what others do.
Modern companies are not so different. We all have our ‘go-to’ person in some other part of the organization who gets it done and we all know that guy who never responds to emails. These underperforming areas exist due to lack of competency, tools, or resources.
Under performing departments on internal CX are not only an inefficient organizational nuisance, they can also cost you customers. Long processing times, cumbersome and unnecessary red tape, and general unresponsiveness internally will also always be manifested in the front line not being able to serve their customers as effectively.
Wouldn’t your organization want to move away from internal performance hearsay and gossip as a method to gather this important information and get to a more disciplined and actionable approached?
Measuring Internal Service Levels
Back in my days of working in organizational development (OD) we worked with a bank to conduct a survey of associates. While they had their normal employee engagement work, we also developed and fielded quarterly an inter-departmental survey. The results were then tabulated and sent back to each department as to how they did. It was also a point of discussion in business planning and used as a barometer of leadership competence.
In the end it made everyone accountable for customer experience and was great way to bring it to the forefront of the culture. We made it very easy to complete and we did all the leg work in reporting. It also helped bring teams together in much the same way a hotel or other organization focuses on their external CX measure.
Interested? Here’s how we did it.
Step 1: Determine what matters in your culture
Each culture is a bit different in determine what makes for good customer experience. While various tools of yesterday year have been developed such as SERVPERF andSERVQUAL you really need to make it your own. You should try and have a standardized battery of no more than 5 questions in your survey. I generally recommend the following domains:
Easy to do business with – do other departments throw up roadblocks or is easy to get things done with them? Do they respond in a timely manner?
Domain Competence – do they have the skill set to do their job effective as a department and are they able to render internal services effective? Can they get done what they are supposed to getting done?
Empathy – do they treat me as an important customer and understand the needs from my point of view, or they focus on their viewpoint only in providing service?
Others may be things such as trust, value, quality, range of services, and relationship but if you ask something along the lines of three above you will get to core of what makes for a good customer experience in most internally.
If you have to make it your own, so make sure these are dimensions are ones that everyone can live by. I usually recommend a series of short group discussions with different parts of the organization to get both the concepts and the proper language identified. It’s goal setting 101: if you are going to be held accountable to some kind of metric, it’s best to have buy in on what that metric is.
Step 2: Determine what the core deliverables are for your department
If you are in corporate accounting, you keep track of budgets. If you are in marketing, you help promote your company’s products and services. If you are in HR you are recruiting, selecting, onboarding and engaged in employee relations. You get the idea. Pick the big 3-5 deliverables for which your department is responsible and ask people to evaluate how you are doing.
You may also want to swap certain measures in and out as you experiment with new initiatives or services you are providing; or perhaps just how you are delivering. You want to maintain some continuity so you can figure out if you are improving or not, but there is some flexibility here to change and adapt to the changing needs of the department.
Step 3: Develop a Departmental Taxonomy
Not all departments interact with all other departments all the time, so it will be important to get a departmental list together. You will have some decisions to make. What level of specificity do you want to go to? Do you want to have corporate communications, digital, brand, product, and retail marketing all rolled up together or separated? The trades off are if you get too specific it becomes a vary burdensome survey for respondents. You go too high it becomes watered down. Generally, we find that units of 5 or more are a good rule of thumb to be a minimum and units larger than say 75-100 should be broken apart if possible.
Step 4: Decide if you want transactional or relational measures
In the CX world a transactional survey is exactly what it sounds like. It happens right after the interaction and asks specifically about that interaction. Relational studies, on the other hand, ask about things in general with the department. There is no one “best” approach, and in fact, in customer CX programs we often times do both, with the transactional informing the relational studies.
How to decide? If most of your departments have a ‘beginning’ and ‘end’ point to an interaction or if they have a logical trigger, then transactional is going to be more actionable. Many times, that is not the case, and services are rendered on an on-going basis. In this case the relational approach might be better. If there are many small interactions, you may also want to go the relational approach to avoid everyone spending their days filling out surveys on one another.
Relational measures are generally done in waves. For example, in my banking example we did it quarterly. In the case of a transactional survey it down after the transaction; a completion of a report or project. The key here is making sure you are asking the right questions and not too often.
Step 5: Deploy
This is where you are going to need some technology. I would not recommend trying this with Google forms or freeware, you will get hopelessly entangled to the complexity of who to whom and customized content by area.
You will need a tool to conditionally display questions. Also, you need to do a sample load so you can tie back individual departmental responses and limit multiple responses from individuals. Paid versions of self-service platforms will fit the bill (AYTM, Qualtrics) if you want to do it yourself (like I said it can get complicated), or if you want to leave to the experts there are many out there (MaritzCX, Medallia, InMoment, Confirmit, Customerville, etc). Some platforms do both.
The general structure so be to ask about what departments with which individuals interacted. Then the general questions (from Step 2) and then the departmental specify question (from step3). You may wish to limit the number of departments they have to evaluate to ensure the survey doesn’t get too lengthy, but in many cases, you will find most people only interact with a handful of other departments, so this might not be a concern. You may also want to offer up a comment box where people can hand out praise or productive criticism.
Step 6: Analyze
Again, there are many great analytic platforms out there that can be used in the analysis of data. Typically, the best approach is through dashboards. Self-serve platforms have dashboards usually built in, or you can simply import it into Tableau or other data visualization platforms. The CX vendors all have dashboards pre-built with access level restriction built in to make it easy for you.
Step 7: Doing
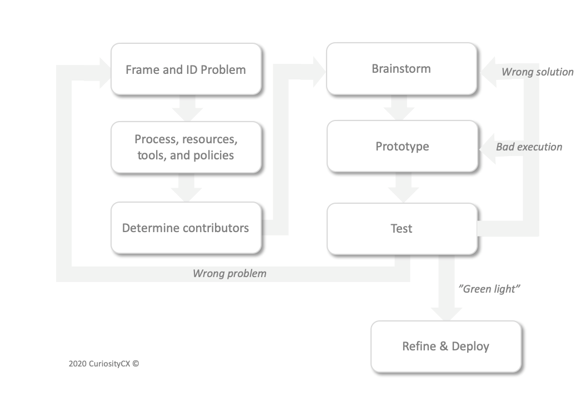
This is the most important step. Taking the information and using it. This can be used as a rallying cry for the team to focus on a specific area. While there are many approaches to this, the formula that have seen work best is the following:
- Figure out what the right problem is to start with
- Determine what processes, resources, tools, and policies may be causing it
- Figure out who would be involve in solving it
- Get in a room with those people and brainstorm ideas
- Pick one, build an MVP, and test it
- If it worked great! If it didn’t was it 1) not the right problem 2) not the right solution, or 3) bad execution
Lemons into Lemonade
In the end my kids mopped up, even encouraging a neighborhood competitor to literally pitch their tent around the corner with a competitive offering (market intelligence reported the offering to be “too sour”). With only two of them it doesn’t really make sense to evaluate one another, but in much large organizational contexts where there are even low churn rates many people are leaving and joining the organizational daily. Getting a read on who is doing well and who is not doing well in delivering will help you understand both work flows as well areas for investment and coaching to improve their performance. This, in turn, will help your organization deliver a better experience to those who are paying the bills: your customers.


