
In the last post we learnt that to understand Customer Value, we have to build a customer’s Waterfall of Needs and attribute trees to illustrate the components of Customer Value. We also found that each value item has a relative importance, and we showed this on the attribute trees.
To move ahead, we must also get the Customer’s perception on whether we are creating less or more value on each of the attributes. This is called Customer Value Added.
Customer Value Added
We ask our Customers to score our company on each of the attributes. This is our score. We then ask our competition’s Customers to rate them. We call this the competitor’s score. We then develop a relationship between our score and the competition’s.
Customer Value added is our Customer’s perceived rating or score of the value we deliver divided by the perceived rating or score competition gets on the value they deliver to their Customers.
To measure Relative Value Added we need to
- Measure market perceptions of value our company adds
- Measure market perceptions of value added by competitors
- Define a relationship between the two
Customer Value Added
CVA = Perceived worth of your offer / Perceived worth of competitive offer
Measuring Customer Value Added
The best way is to ask our Customers and our competition’s Customers to rate each of the attributes that are important to the Customer (We showed how this can be done in the previous chapter). The typical way is to ask: Rate the product from company A on a 10 point scale. We anchor the lowest point on the scale (in this case 1) and the highest point in the scale (on a 10 point scale it is 10). So we tell the Customer that 1 is very poor, or ineffective (based on the question) and 10 is excellent or very effective (again depends on the question). The way we ask the question, as an example is:
Rate the service of company A on a 10 point scale, where 1 is very poor and 10 is excellent. And so on.
Once we have the perceptions of our Customers and the competition’s Customers, we can divide one by the other to get the Customer Value Added. Typically, the CVA score after you have divided your score by the competitor’s score can be:
- Greater than 1.0: This means you are better than competition
- Between 0.98 to 1.02: This means you are equal to your competition
- Less than 0.98: This means you are worse than your competition
Once we have these scores, we can calculate the relative importance of each of the attributes (we showed the importance in the last chapter.)
Note, that we do not generally ask one Customer to rate two companies. We ask the Customer to tell us whom he generally buys from. Let’s say he drinks Pepsi 70% of the time and Coke 30% of the time. We ask him to rate only Pepsi (and internally we view him as a Pepsi Customer). Let’s say the next Customer says he buys Coke 75% of the time, and then we ask him questions only about Coke.
Why do the scores have ranges? This is because statistically it may be difficult to differentiate between 0.98 and 1.02 if we are looking at a sample size which gives data to within plus or minus 2% accuracy.
How do we get the Customers scores?
There are many ways of getting the Customer’s perception of a company.
1. Our perception of the Customer’s perception, or a desk study
Here executives who are or think they are knowledgeable of the market place or of the Customers build the waterfall of needs and the attribute trees shown in Chapter 2. They can then put their perception of how Customers would score these attributes for their company and for competition’s.
We find that the first time executives do this, they will all have different perceptions (their perceptions are based on their own thinking). Thus one executive might say that cost is 30% and the next executive might say cost is 70%.
With practice, and by becoming more aware of the marketplace and the Customers, we find the ratings become closer and closer to what Customers might say.
2. Talking to Customers, and our intermediaries (or even a focus study) or qualitative research.
Here we find that we are closer to the marketplace. But the way we ask questions can influence the market place. So if we ask do you like Coca-Cola and Pepsi, the answer could be yes. But if we asked which one do you like better, the answer could be different; and different from which one would you buy; and different from which one will you buy if both are priced the same or one is on sale. Note which one you like maybe different from which one you buy!
The qualitative research can be used to derive the value attributes and waterfall of needs
3. Using documented studies: These are often done by research groups, or reported by them
4. Conducting a market research on your Customers and competition’s Customers.
First, you must remember how we define our Customers and the competition’s Customers. We discussed this towards the end of the section entitled Measuring Customer Value Added in this Chapter (Chapter 3).
Second, you must segment the market place. Let’s take Pepsi and Coke. We can segment the market as USA, UK and Canada (this is geographic segmentation). We could segment by city. We could segment by gender, or age group. Or we could segment in a city by age group.
Third, you must have an idea of the market place size and the number of Customers in the segment we wish to study.
Fourth, you know from experience you cannot measure everyone if the marketplace is large. What you do is to sample the market place in the segment you wish to study. The sample has to be representative of the segment.
Thus if you had 50 Customers, and you measured all 50, then your measurement accuracy will be 100%.
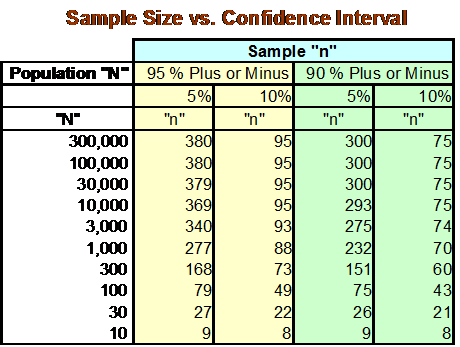
But if you had 50000 Customers, you cannot interview all of them and you need to sample them. Your sample size depends on the confidence level you want to have on the data. Let’s say, you want to have 95% confidence in your data. You will also have to decide on the precision of the data. So if the average is 900 for a particular question and the precision of the answer you are willing to accept is plus or minus 2%, then the number 900 could be 855 (900 minus 5% (or 45)or plus 5%) or 945. We have 95% confidence that the number 900 is actually between 855 and 945.
The sample size is shown below. Thus for 95% confidence interval and plus or minus 5% precision interval we should interview 380 people. For 90% confidence interval and plus or minus 5% precision interval, we should interview 300 people:
This data is reported in different boxes. There could be 5 boxes if the measurement scale is 1 to 5. Normally we report the data in the top two boxes or the bottom two boxes. This kind of data and reporting is common in satisfaction study.
|
Top-Box |
||||
|
Strongly-Disagree |
Disagree |
Undecided |
Agree |
Strongly-Agree |
|
1 |
2 |
3 |
4 |
5 |
Sample size for a Customer Value Added study:
In a Customer Value Added study, we are reporting comparative data. Because of this our sample size is usually one third to one fourth of the ones required for only studying the top boxes. Thus for 95% confidence interval plus or minus 5% precision interval instead of 380 sample size we only have to measure 95 to 130 people for our company, and the same number for our competitors. If we are studying ourselves versus 5 competitors we will need 600 to 750 samples (100 to 125 samples for each of 6 companies (ourselves and 6 competitors). If we were doing the study in a normal way or for satisfaction we would need 380 times 6 or2280 where the data would be significant for each company.
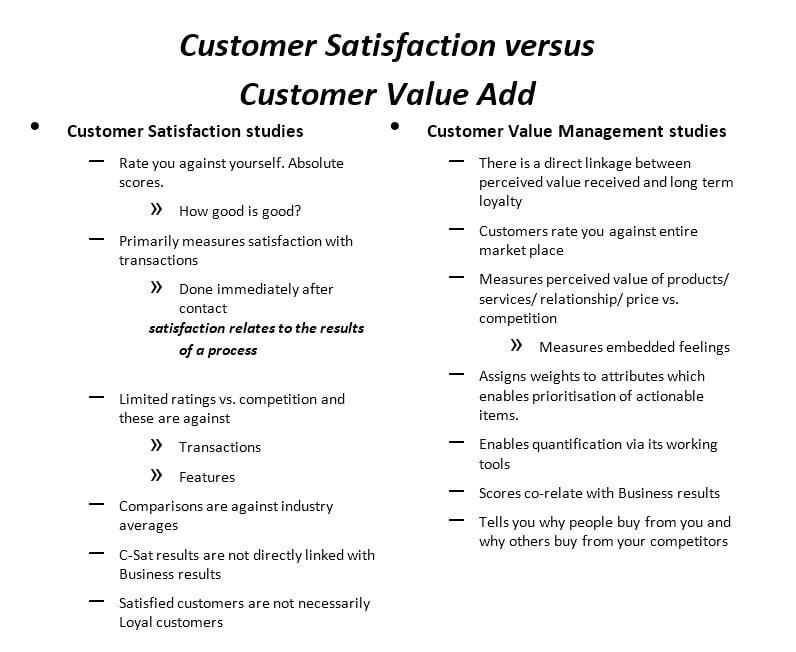
Value study vs. Transaction study
The bulk of the satisfaction studies are conducted right after or very close to the transaction. The questions are asked of the transactor or the one buying or consuming. Such a study will require for very large Customer bases a sample size of 380 for 95% confidence with a precision of plus or minus 5%.
In a value study we are looking for ratios and have a third or a fourth of the sample size for each company. The other important differences are:
1. The value study is not conducted on the user or the buyer per se.
The Satisfaction study is a transactional study and conducted on the end user. In a satisfaction study, assuming your mother buys the Coca-Cola and you consume it, we would ask you about the drink, and how satisfying it was. We would ask your mother about her buying experience.
The Value study is a decision-maker study. In a value study, we would ask your mother (the decision maker about the value of the Coca-Cola. Assuming she does not drink Coca-Cola, she has a perception of who and how it was consumed.
2. The Value study is done some time (days or months) after the transaction so that we are looking at the memory of the experience, not at the experience.
In a satisfaction study, we want to capture the satisfaction of the transaction as close as possible to the event. As an example, let’s view an in-house travel department. Many of you stay in hotels, which the CXO in charge of deciding where you stay may not stay. He makes a value decision on which hotels to choose for middle level executives. This is based on his impression of how you view the hotels, and his/her perception of the benefit of the hotels, and the cost and what the value of the hotel group is to the company (our people are happy, they find the hotels convenient, etc. etc. and the costs to the company are reasonable: the value (benefits/cost of this hotel group is higher than the ones we did not elect to do business with.
Before we go further, the market study has to be planned carefully. It has to have in built quality. It must ask the right questions of the right people at the right time.
In next chapters, we will learn how to interpret the scores we get from a survey. Before that we will discuss how data is viewed and then discuss the data itself
Discussion
You have been able to see how we can measure the Customer Value Added score. It is a comparative score. We have also discussed different ways of collecting market data, and that the best way is to conduct a Customer Value Added study. We re-learn what you already knew about sample sizes and why the Value study requires one third to one fourth the sample size of those required for a normal satisfaction study. We also see the essential differences between a value study and a satisfaction study or a transaction study. The transaction study is done close in time to the transaction and is conducted on the buyer or end user. The Value study captures the memory of the experience through the decision maker and not the actual user. The Value study is conducted much after the transaction.
Do it yourself
Think of a product or a service you use that is provided or mandated to you by your company, even though you are the end user (easy examples are laptops or cell phones. Think beyond these). Ask why they might have been chosen by the higher-ups. Could it only be cost? Or only benefits? Or the value perceived by the higher-ups?
Think of your current satisfaction study? Does it capture value? Does satisfaction relate to loyalty (we want your perception, as we have not discussed this). Build a set of different segments for the market place or your Customers. Guess the Customer size for these segments, and how many competitors. Ask how much confidence and precision you want in the data, and what your sample size be for a normal study and for a value study.
You can contact the author at [email protected] for answers or view the website www.CustomerValuefoundation.com


