
Customer experience (CX) is more important today than ever. Providing an exceptional customer experience consistently, though, is hard. Measuring customer experience and tying it to tangible business outcomes is harder still.
The first step in your journey to improve CX is to measure customer experience. While you will be familiar with widely known customer experience metrics such as Net Promoter Score (NPS)® or Customer Satisfaction (CSAT), how and when you calculate these metrics, as well as how they influence your actions, can have an big impact.
In this post, I’ll discuss which customer experience metrics to use and how to improve them to quantify, monitor and enhance your customer experience by taking a journey-driven approach.
Use Journey Analytics to Improve How You Measure Customer Experience
“Companies are increasingly using customer analytics techniques like customer satisfaction analysis, customer engagement analysis, and customer journey analytics to understand and improve CX.” — Forrester, The State Of Customer Analytics 2017
Given the importance of CX measurement and the resources investment it involves, it is critical to do it systematically, comprehensively and efficiently. Below are five ways that you can use a journey-driven approach to effectively measure customer experience.
1. Use the Right Customer Experience Metric at the Right Point in the Customer Journey
A lot of companies tend to use one customer experience metric, usually NPS or CSAT, throughout the customer journey. This single metric approach can be really problematic. If the customer has different experiences and different needs at each stage of the customer journey, how prudent is it to employ just one metric at each of these different stages?
Let me explain with an example. You are expecting a product delivery and you call into a company’s customer care center to get an update. Before hanging up, the customer care agent asks if you would recommend the company (NPS). But you haven’t yet received the delivery, leave alone had a chance of using the product. A hundred things could go wrong (or right!) in your experience along the journey.

To get much more accurate and actionable results, companies should first discover end-to-end customer journeys using customer journey analytics. Do a deep dive and discover micro journeys from within important macro journeys. Once you have understood the different touchpoints and how they impact the overall journey, you would be in a far better position to pick the most appropriate metric to use at each touchpoint.
In my example NPS is not the best fit, as it works well at the end of a process cycle (more on this below), such as contract renewal. The key is to be flexible and decide after discovering the customer journey in detail.
2. Ask For Feedback Through the Customer’s Preferred Channel At the Optimal Time
Your customer has limited time. And they want to expend as little of it as possible giving feedback to you. Making your customer experience measurement process short and easy is typically a goal for most customer experience teams. But equally important is reaching out to customers at the most optimal time through their most preferred channel.
This isn’t as obvious as it sounds.
Say you want to capture feedback after a customer calls into your call center. To do this, you are likely to pass the customer on to an IVR platform to capture their feedback at the end of the call. But this may not be the best way for the customer who has already been on the line with an agent for over ten minutes. She likely wants nothing more than to hang up and get on with her life. Maybe an SMS or a brief email would produce a better result.
Before you act, it’s best to avoid acting purely on your intuition. Use your customer journey analysis to discover your customers’ preferred channels for engagement. A customer journey analytics platform can trigger engagement at any point in the customer journey by integrating with your existing martech stack. This way you never have to leave the environment to set up an interaction and indeed the whole process can be automated.
Keep in mind that customers typically have feedback fatigue from being asked for their opinion by every service provider at every interaction. So, you want to ensure that you reach out to measure customer experience at the most important moments, also known as ‘moments of truth’. If you are not tracking the entire customer journey, you will likely fail to measure important interactions and thus miss the step that is failing and needs improvement.
Using customer journey analytics, you can discover the most important points for interaction and only prompt customers for their opinion at that point.
3. Calculate Your Customer Experience Metrics for Individual Behavioral Segments
All customers don’t behave the same way, nor do they have an equal impact on your revenue. As a customer experience professional, you need to make sure your CX measurement efforts focus on your most valuable customers.
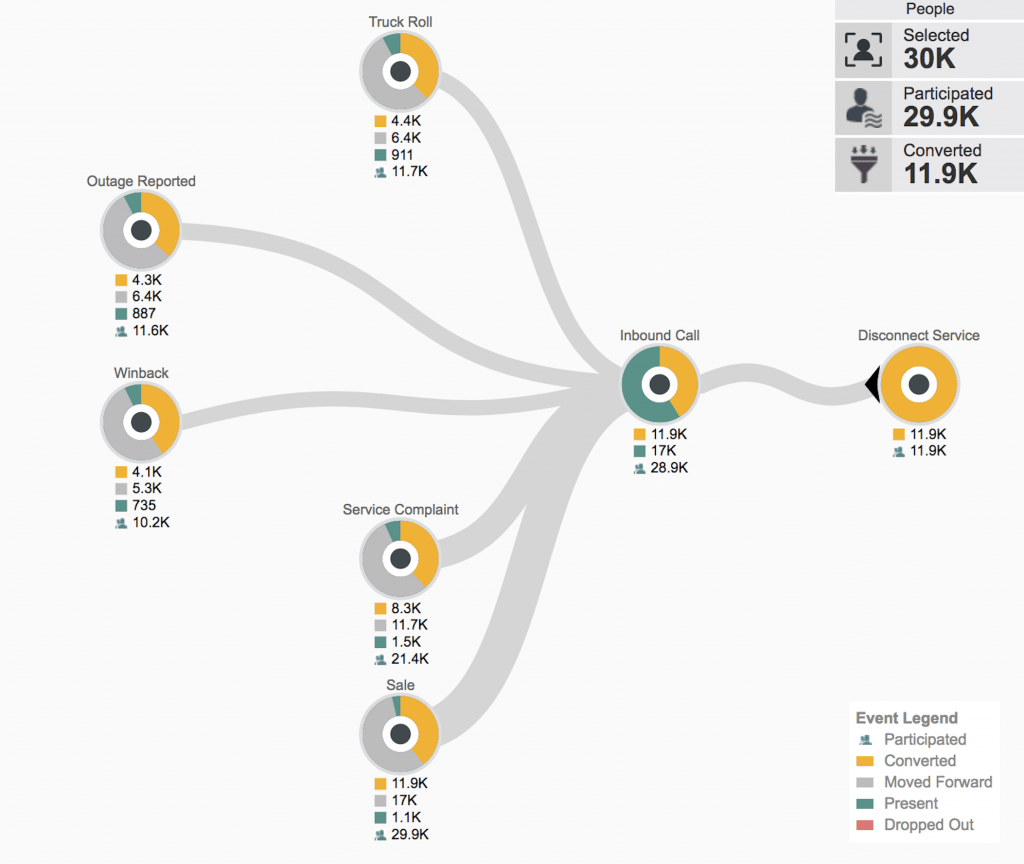
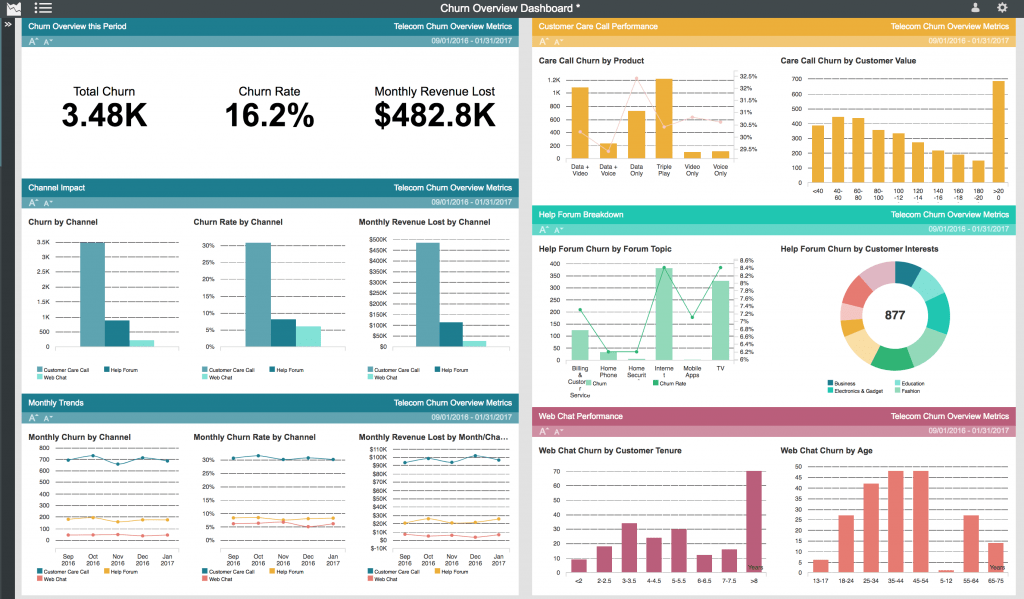
Customer journey analytics helps you do just that. For instance, customer journey analytics for telecom helped a provider uncover which customers were having the highest number of unresolved complaints. Next, they determined which of these customers called the customer care center and then eventually went on to discontinue their service. Finally, they calculated their key CX metrics for each behavioral segment and monitored the impact of their improvement programs on these metrics over time.
The U.S. health insurance sector also employs segment-based CX metrics. Some insurers, for example, focus their customer experience measurement on healthy customers, as they are the most profitable and use their health insurance less often. Health insurance providers therefore want to make sure that their healthy customers remain happy, so they don’t take their business to another insurer.
A growing number of customer experience professionals use customer journey analytics to identify behavior-based segments with highest profitability, most growth potential and high influence.
4. Monitor Customer Experience Metrics in Real Time and Over Time
Customer experience teams need to share detailed reports on metrics both at a journey-level and at an overall level. This helps executives get a status check on critical insights. Customer journey analytics tools can be used to create custom dashboards to help you monitor these metrics in real-time and also track and report on them over time.
Moreover, you can access the journey driving each metric with a simple click to reveal real-time statistics, as well as discover any high-impact micro-journeys.
5. Determine Your Customer Experience Measurement Priorities
Finally, customer journey analytics can be used to prioritize which customer experience metrics you create, monitor, report and act on. After analyzing your customers’ behavior you may realize that you need to add metrics for key outcomes, perceptions and real-world behavior that you aren’t capturing or are only doing a superficial job of tracking.
Those metrics that are well aligned at important points in the customer journey should be prioritized. Similarly, customer experience metrics that are not well aligned should be thoroughly analyzed to determine whether the resources being spent on measuring, analyzing and reporting them are better spent elsewhere.
Use Case: Using Customer Journey Analytics to Make NPS Actionable and Quantify the ROI of CX Initiatives
The CX team at a retail bank is tasked with updating the onboarding process for new accounts. To measure whether the new process is more effective, they decide to use NPS to evaluate each process.
Their current VoC platform can’t provide journey-level analyses, so the CX team uses the Pointillist Customer Journey Analytics platform to measure NPS within the context of each of the two onboarding journeys.
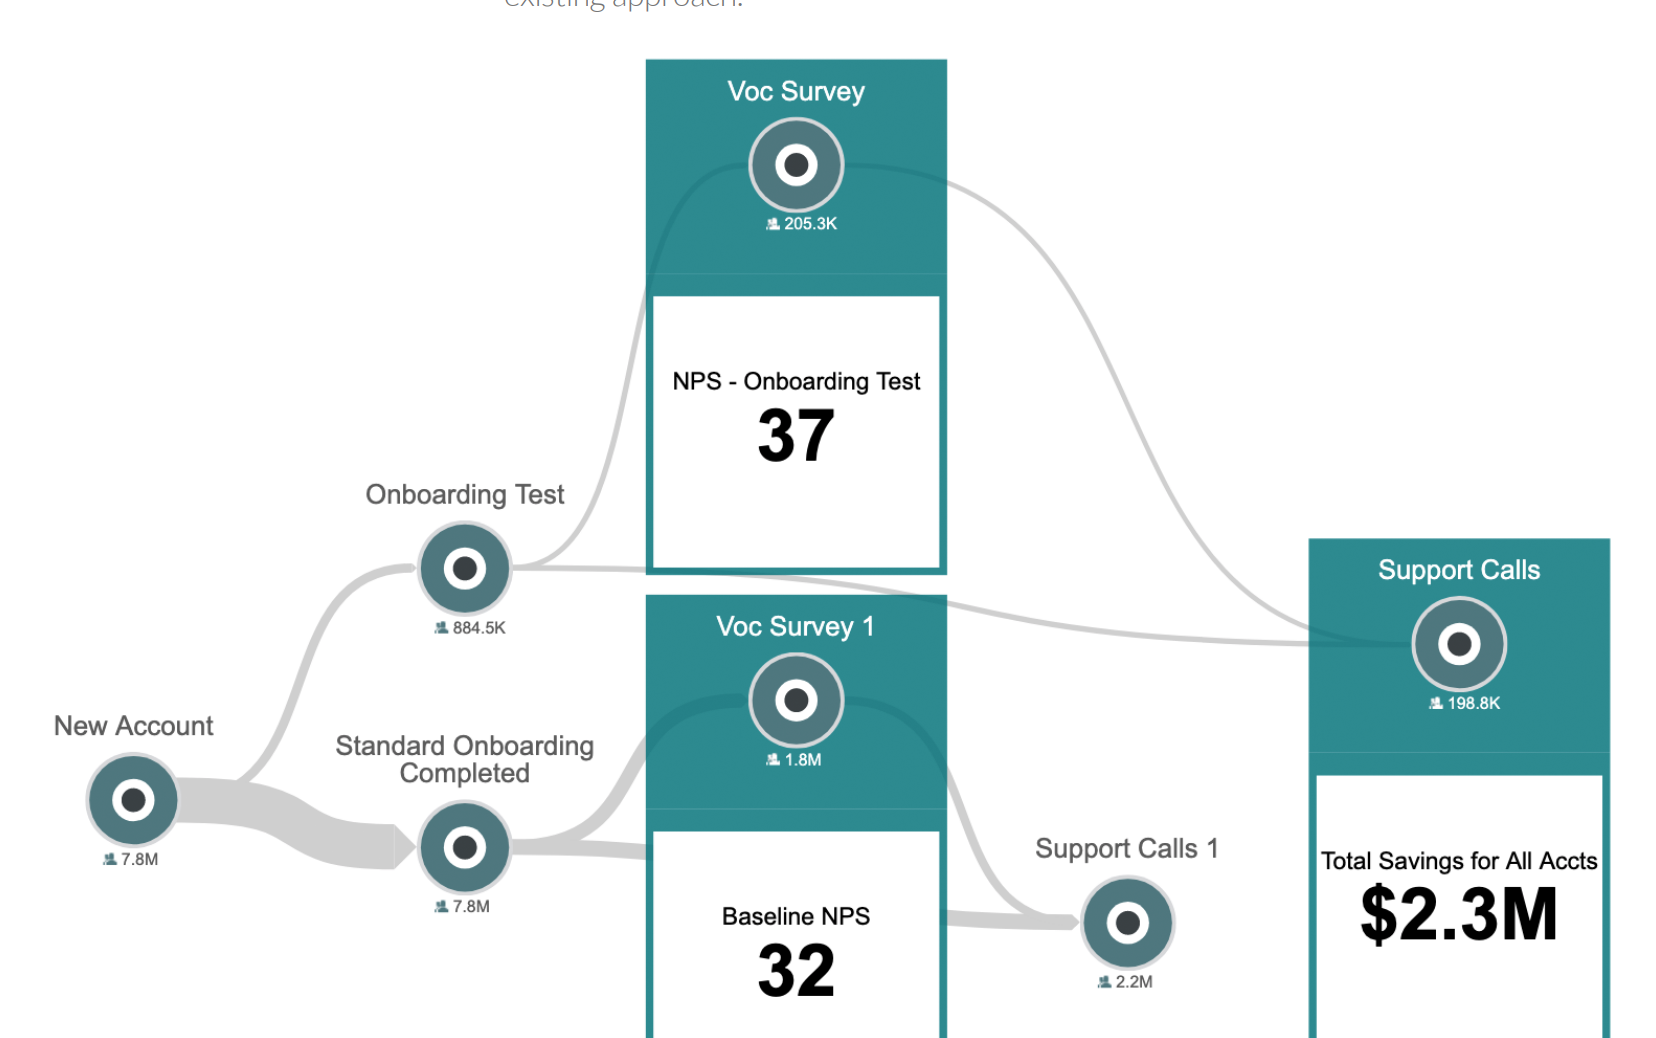
Powered by Pointillist, the team discovers that the NPS for customers using the new onboarding approach is 5 points higher than for those using the existing approach.
Moreover, the rate of customer service calls is reduced. The lower support call rate translates into a potential $2.3M cost savings, assuming the improved onboarding process is applied to all new accounts.

An Overview of Customer Experience Metrics
Source: Google
Whether you’re just starting out or have an established CX measurement program, it pays to review the wide variety of ways to measure customer experience. In this next section I’ll take a look at the key customer experience metrics that will help you measure the health of your CX.
Retention-Related Customer Experience Metrics
A focus on retention enables companies to keep their profitable customers, improve customer loyalty, reduce churn, increase cross-sell and upsell, and increase the Customer Lifetime Value. The most important customer experience metrics related to retention are:
1. Net Promoter Score® (NPS)
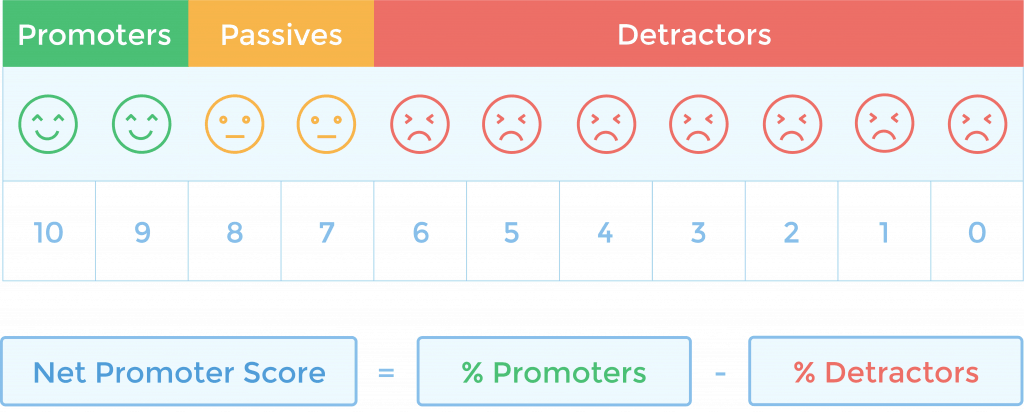
Net Promoter Score shows the percentage of your customers who would recommend you to others—friends, family or colleagues.
Net Promoter Score (NPS) is the most well-recognized customer experience metric that there is. It is also the simplest. NPS is typically measured by asking the following question:
How likely are you to recommend [business] to a friend or colleague?
Customers rate your company on a scale of 0-10. Respondents are grouped in the following categories:
-
- Promoters (Score 9-10)
- Passives (Score 7-8)
- Detractors (Score 0-6)
Calculate Net Promoter Score by subtracting the percentage of detractors from promoters.
NPS is so widely used because it’s easy to understand, simple to conduct, and scalable to produce.
2. Customer Satisfaction (CSAT)
Customer Satisfaction is the mean or average satisfaction score of customers for a given experience.
It is typically measured by an automated survey that asks customers to rate an experience such as a product return, a customer care call or a password change through an auto-generated post-interaction survey. The scale typically ranges from ‘Very Satisfied’ to ‘Not at All Satisfied’.
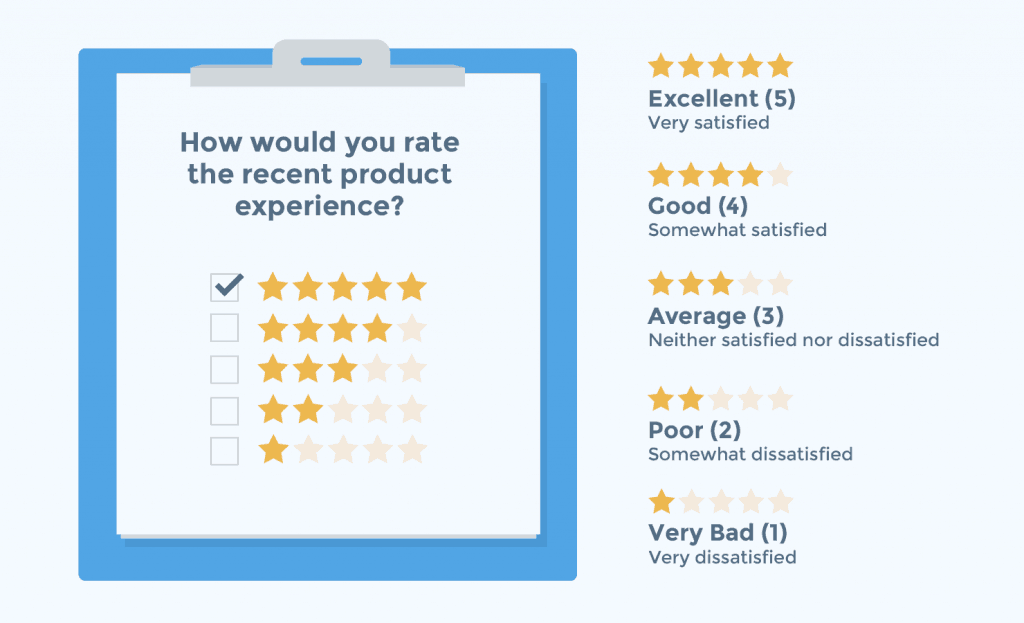
CSAT is a useful metric as it is based on an immediate reaction of users’ to a product or service experience. In fact, a lot of businesses target obtaining a CSAT score within 30 minutes of a product or service being used.
3. Customer Churn Rate
Customer churn rate is a measure of how many customers stopped buying from your business or canceled their service in a given period of time.
Basic churn rate is calculated by determining the customers lost during a timeframe and dividing it by the total number of customers at the start of the time frame.
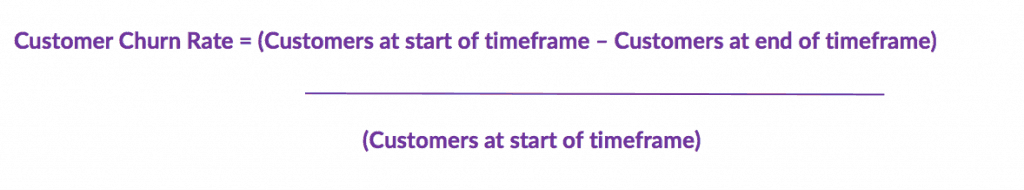
Churn rate can also be calculated as revenue churn i.e. proportion of recurring revenue lost in a given time period. Revenue churn is commonly used in SaaS and other subscription-based business models. [Read more about churn: How to reduce churn using customer journey analytics].
4. Customer Effort Score (CES)
Customer effort score determines the relative effort required by the customer to work through an interaction.
This interaction could be a simple one such as looking for a product or a more difficult one such as resolving a technical issue. It is usually measured on a defined scale through an automated post-interaction survey. For instance, you could ask, ‘How much effort did you have to put in to resolve this issue?’ and the responses could vary from ‘Very low effort’ to ‘Very high effort’.
CES is a good metric to measure whether your efforts to reduce customer experience obstacles are bearing fruit or not. Customers are looking for speedy and convenient resolution to problems and resent having to expend a lot of effort in a product or service related task.
Efficiency – Related Customer Experience Metrics
Efficiency-related metrics focus on doing the most optimal operational activity to deliver a delightful customer experience at a lower cost to the company.
5. Average Resolution Time (Time to Resolution)
Average resolution time is the measure of the time it takes to completely resolve an issue, beginning from when the customer first brings the issue to attention and ending when the issue is fully resolved.
This metric is also sometimes known as ‘Time to Resolution’, ‘Mean Time to Resolution’ and ‘Resolution Time’. It is typically calculated by analyzing a team’s overall average time to resolution of a group of cases within a specified time frame.

Average Resolution Time correlates well to customer satisfaction. Longer it takes to resolve customer complaints and issues, unhappier they become, even leading to churn sometimes. This metric is also a good yardstick of how your team is performing and how efficient your processes are.
6. First Contact Resolution (FCR)
First Contact Resolution measures the number of customers whose question or request is resolved on the first attempt.
You can define FCR criteria based on your unique business by answering questions such as, ‘Is FCR affected when a customer contacts the wrong department,’ or ‘Does FCR include abandoned calls?’ or ‘Does resolved mean that the customer’s problem was solved and they were satisfied?’
The formula for calculating FCR will differ according to how you define the criteria. However, here’s a basic way to calculate it:
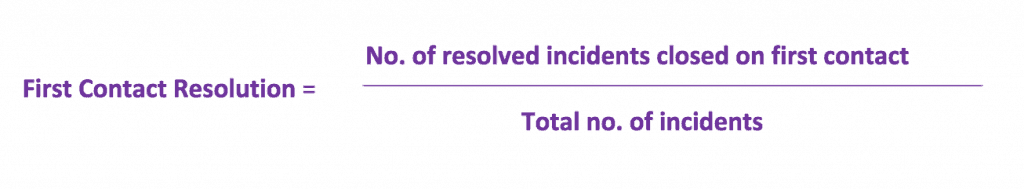
FCR has gained a lot of importance among customer experience professionals as a high FCR typically indicates high customer satisfaction. FCR also indicates that your customer service processes and teams are working efficiently and producing the desired results.
It’s Your Turn
A disciplined and effective customer experience measurement program is essential for companies to understand which parts of the customer experience are working and which parts need to be improved. Understanding the key customer experience metrics and applying them at appropriate stages with the most important customers is paramount. Customer journey analytics can play a key role in this endeavor by providing a journey-driven perspective and improving your return on your investment in customer experience measurement.
Which customer experience metrics do you use as a CX professional? Is your approach to CX measurement journey driven? Let me know in the comments!
Net Promoter, Net Promoter System, Net Promoter Score, NPS and the NPS-related emoticons are registered trademarks of Bain & Company, Inc., Fred Reichheld and Satmetrix Systems, Inc.
Screenshots courtesy of Pointillist. A version of Measuring Customer Experience Beyond NPS originally appeared on the Pointillist blog.


