

Earlier this year, I have written about why word clouds suck. Is there a better way of visualizing customer feedback? Yes, there is, and the best thing about it is, you can even use Excel to create these visualizations – if you represent the data correctly.
In this post, you will learn three simple but effective ways of how to visualize customer feedback.
At Thematic, we invented these three techniques by working closely with customer insight professionals. If you care about data, and if you care about finding out what customers are saying, read on.
Preparing customer feedback for visualization
Customer feedback comes in two forms: scores and text. Scores are easy. They can always be represented as numbers, and there are different ways on how to combine them into an overall score for all customers:
– Average (e.g. number of stars)
– Subtract percentage of low scores from the percentage of high scores, e.g. Net Promoter Score (NPS) or Customer Satisfaction Score (CSAT)
To keep things easy, let’s assume that we’ll use NPS.
When it comes to text, we need to code each response with one or more themes first, according to a code frame. A theme is a single or multi-word concept. It should be meaningful within the context of the dataset.
For example, let’s say that our dataset contains responses by university students to the question, “What is the likelihood that you would recommend our University to a friend or colleague?”
– Meaningless themes: university, student, quality, good, study, first year
– Good themes: administration, campus, courses, school reputation, good university
A code frame is a flat list or a hierarchy containing these themes. Check out our guide on how to code survey responses by hand. Alternatively, this task can be automated using text analytics.
Visualization 1. Impact
This visualisation answers the question: “What’s the impact of each theme on my overall score?” First, you need to do the following calculations:
1. Calculate overall NPS
2. Calculate NPS in the subset of responses that do not contain that theme
3. Subtract B from A
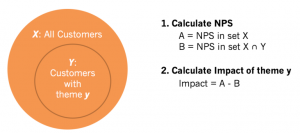
Calculate theme impact on NPS using this simple formula
Now you can visualize this data, listing each theme as a bar chart:
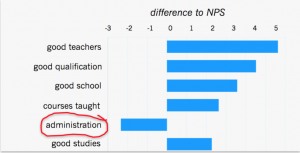
Visualising difference in impact on NPS
This visualization shows the relative impact of each theme, whether it is positive or negative. In this specific example, NPS can be improved by at least 2 points by fixing issues with administration.
Visualization 2. Key Drivers Analysis
This visualization answers the question: “Which themes are tightly linked to drops and rises in my score over time?”
First, we need to compare two sequences of numbers: NPS over time and theme frequency over time. Using Excel, you can easily calculate the correlation between two sequences, which can be either positive (the more themes the higher the NPS, see picture below), or negative (the more themes the lower the NPS).
Second, you need to plot theme frequency against the absolute value of theme correlation with NPS.
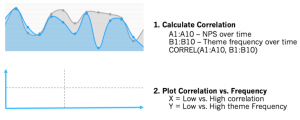
Theme correlation with NPS
The resulting visualization could look something like this:
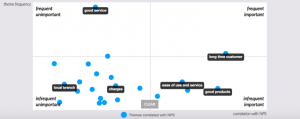
Key drivers of NPS
It shows that most themes aren’t frequent and have a low correlation with NPS. In this example, loyalty and good products drive NPS, but most of the other themes don’t matter.
Visualization 3. Reward and penalty
This visualization answers the questions:
1. “Which attributes of my service delight customers so that, they reward me with a higher score?”
2. “Which attributes of my service do customers expect from me, and if I don’t deliver, penalize me with a lower score?”
For each theme, simply calculate the percentage of Promoters and Detractors, and then plot these values on as following:
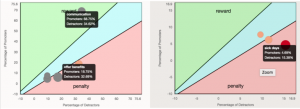
Reward and Penalty calculation from NPS analysis
Themes with a higher percentage of Promoters are our reward factors, whereas themes with a higher percentage of Detractors are penalty factors. In this example, the company exceeds customer expectation on communication. However, it underperforms, when it comes to customer expectation about benefits such as sick leave.
Even the most accurate word cloud is limited in the insights it provides. It answers the question: “What do people talk about?” – in a very fuzzy way.
The three visualizations we’ve shown here provide answers to more targeted questions:
– What’s the impact of each theme on my overall score?
– Which themes are tightly linked to drops and rises in my score over time?
– Where do we overperform and where do we underperform, when it comes to customer expectations?
In all three cases, you need to have a satisfaction score associated with each comment. And, the themes need to be meaningful enough to draw conclusions from the answers provided by customer survey respondents.
If your role is to find deep customer insights, these visualizations provide a starting point. As the next step, you can interview customers to find the reasoning behind their thinking.
In the penalty and reward example, you could investigate why customers have certain expectations about benefits. You can also figure out how you can manage these expectations better.


