
Did you know!
1. Messengers (90.7%), Social Networking (88.4%), and Shopping (69.4%) are the top 3 categories of most used mobile apps worldwide. (Source: Statista)
2. The mobile app development market holds a CAGR of 11.7%. (Source: Grand View Research)
3. There were 230 billion app downloads in 2021. (Source: Statista)
Phew! That’s a lot of downloads compared to a mere population of 7.9 billion humans. FYI it equals 30 downloads for each human body present on the planet.
However, how many of these app downloads last or prove successful?
Whatever be the app category: The critical mobile app metrics like the average retention rate or activation rate of an app lies usually below 10%.
The infographic below offers insights into the retention rate of apps from Statista.
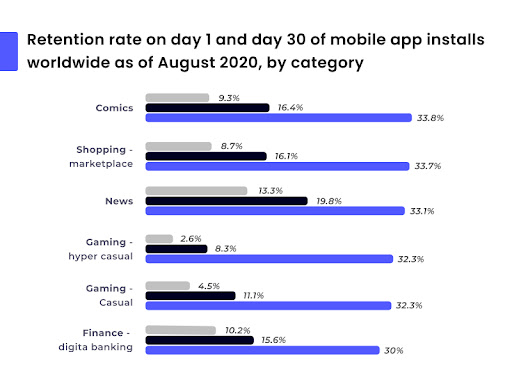
Source: Statista – App Retention Rate
The mobile app market has exploded remarkably in recent years, and it’s now more important than ever to understand how to measure your app’s success before, during, and after launch.
The success of your app can be boiled down to one thing: customer retention. But there are several other key mobile app metrics you should be tracking.
In fact, Peter Drucker, a renowned Austrian- American management consultant, says, “If you can’t measure it, you can’t improve it.”
And mobile app metrics are an effective way of measuring the success of your mobile app. Directly and indirectly, all app metrics refer to the ultimate user experience driving downloads & retention rate of the app.
The table below offers insights into the top mobile app metrics necessary to track for measuring the success of your project!
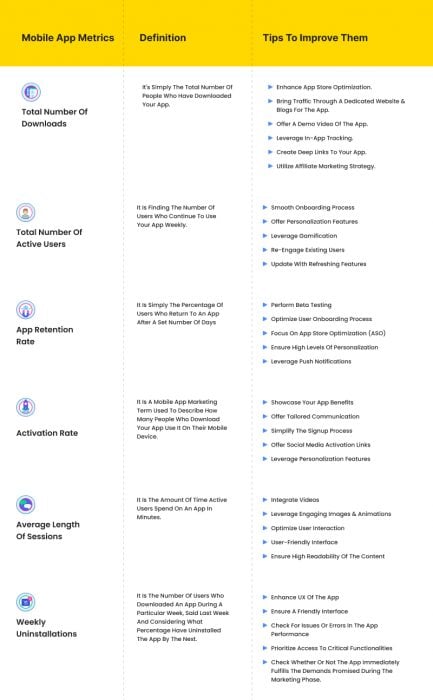
Let’s Explore these Mobile App Metrics in Detail
1) Total Number of Downloads
Definition: It’s simply the number of people who have downloaded your app. It’s good to set a benchmark for how many downloads you need per day/week/month.
It is undoubtedly one of the most straightforward mobile app metrics but essential to track if you want to gauge your app’s success. If you don’t get enough new users coming in each day, you won’t have enough active users, which means less money spent and ultimately less revenue.
The infographic below offers insights into the top app categories by downloads.
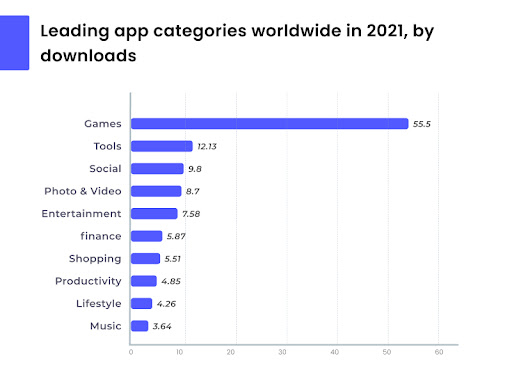
Source: Statista – Leading App Categories
You can also analyze which countries your users are coming from. This information is helpful if you decide to branch out into other geographical markets in the future (which is a crucial decision when considering long-term goals).
Tips to ensure a high number of downloads:
1. Enhance app store optimization
2. Bring traffic through a dedicated website & blogs for the app.
3. Offer a demo video of the app.
4. Leverage in-app tracking.
5. Create deep links to your app.
6. Utilize affiliate marketing strategy.
2) Total Number of Active Users
Definition: It is finding the number of users who use your app weekly. Mobile apps thrive on usage, unlike web businesses, where traffic and conversion metrics are essential. This mobile app metric is critical for building a successful mobile business.
Top-tier apps have an average of 90 daily active users (DAU), but not all industries require that devotion from their customers. Some mobile app metrics can be used as benchmarks or goals for your specific product, like 20 DAU for music apps and 50 DAU for newsreaders and chat programs.
Finding these numbers can be tricky, as most apps don’t publicly share their DAU. Looking at similar companies or products in your industry can help you get a ballpark figure.
Besides messengers, social networking is the most actively used mobile app, as discussed earlier. The infographic below offers insights into the most popular social networking apps in 2022.
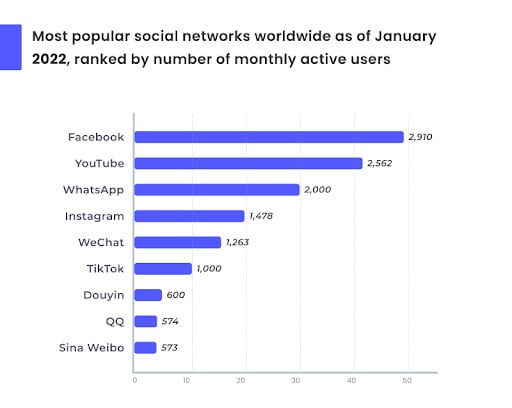
Source: Statista – Leading Social Networking Apps
You can also check out top custom mobile app development companies. They specialize in determining audience size and other data points while developing your app, which is otherwise tough for novice developers.
1. Tips to enhance the total number of active users:
2. Smooth onboarding process
3. Offer personalization features
4. Leverage gamification
5. Re-engage existing users
6. Update with refreshing features
3) App Retention Rate
Definition: The percentage of users who return to an app after a set number of days decides an app’s retention rate. It is considered among the most important mobile app metrics for software developers, as higher app retention rates mean more repeat usage.
It, in turn, means that users find more excellent value in your app. Though it varies slightly by industry and audience, a good benchmark for an average retention rate is about 20 percent or higher.
If you’re starting with your mobile development efforts and want a concrete number, try aiming for an app retention rate above 50 percent at 30 days post-download. In such a way, you won’t need too many downloads before you start gaining meaningful insights into your business model.
Tips to Enhance the Retention Rate of an App:
1. Perform beta testing
2. Optimize user onboarding process
3. Focus on app store optimization (ASO)
4. Ensure high levels of personalization
5. Leverage push notifications
4) Activation Rate
Definition: Activation rate is a mobile app marketing term used to describe how many people who download your app use it on their mobile device. The activation rate of an app depends on factors such as the number of users that download and register, the total number of sessions per user, the average time spent in each session, and other factors.
There are different ways to calculate an app’s activation rate, which involve dividing the total number of active users by the overall number of downloads. Among the top mobile app metrics, activation rate is crucial because it tells you how many people who download your app end up engaging with it and completing one of its core actions.
While UX is the crucial player for ensuring a high activation rate, driving high downloads plays a significant role. The infographic below offers insights into how you can provide a high user acquisition for your mobile app via digital advertisements.
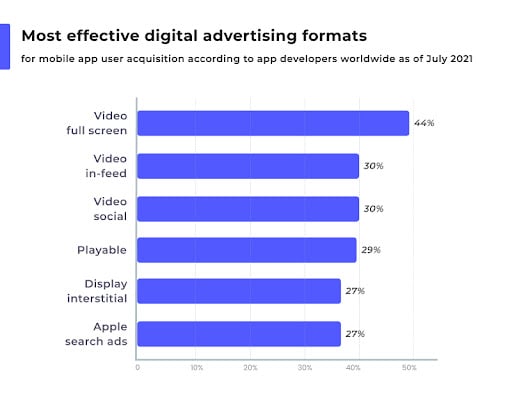
Source: Statista – Most Effective Digital Advertising Formats
It’s essential to post regular updates about your current app activities on social media and other places where users can discover them. You could also try creating some critical marketing campaigns around your product.
These channels allow you to gather key insights about which platforms interest users and how and when they will most likely use your product.
Tips to enhance the activation rate of an app:
1. Showcase your app benefits
2. Offer tailored communication
3. Simplify the signup process
4. Offer social media activation links
5. Leverage personalization features
5) Average Length of Sessions
Definition: The amount of time active users spend on your app per session is measured in minutes. You can set a benchmark for the average length of sessions. If you see that it’s below your model, you need to dig deeper and find out what causes people to spend less time on your app.
A possible reason may be that there are too many errors in design or functionality that are causing users not to be able to complete specific actions within an acceptable time frame.
The infographic below offers insights into the average length of sessions of apps by category.
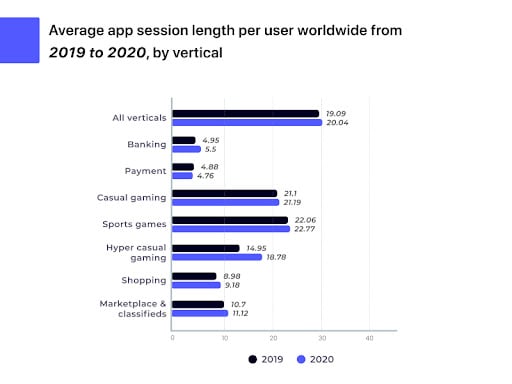
Source: Statista – Average App Session Length Per User Worldwide
A good practice is to ask your app testers to record a session of using your app and then watch it back; you will see where they struggle and how long it takes them to complete tasks.
It gives you great insights into what areas need improvement. You can also use session recordings for training purposes for new employees who will work on your app after you have launched it.
To analyze session recordings, use heatmaps that show where people spend most of their time using your app to spot problem areas quickly and easily.
Tips to enhance the average length of sessions of an app:
1. Integrate videos
2. Leverage engaging images & animations
3. Optimize user interaction
4. User-friendly interface
5. Ensure high readability of the content
6) Weekly Uninstallation
Definition: Weekly uninstallation rate is the number of users who downloaded an app during a particular week, said last week and considering what percentage has uninstalled the app. It is necessary to predict retention.
There is a lot of competition in mobile apps today, so developers need to understand if they can retain their users. One of the best measures that companies should focus on is their weekly uninstallation rate. It helps you know how your retention efforts are going, and it tells you if you need more ways for people who download your app to keep coming back for more.
If a higher number of people don’t come back after one week, you have work ahead of you when it comes time to improve retention rates. It is important to note that many different factors can affect your uninstallation rate; for example, if your app is free, users might not feel as committed to it as they would if they had paid for it.
Tips to reduce weekly uninstallation of an app:
1. Enhance UX of the app
2. Ensure a friendly interface
3. Check for issues or errors in the app performance
4. Prioritize access to critical functionalities
5. Check whether or not the app immediately fulfills the demands promised during the marketing phase.
7) Cohort Analysis
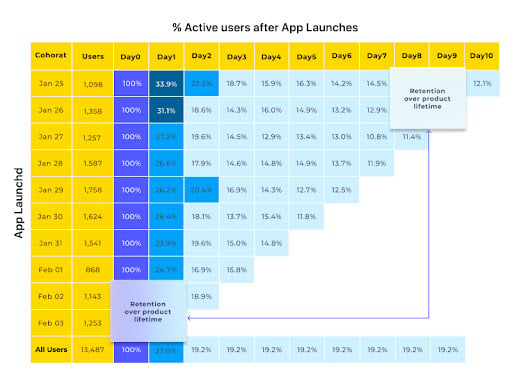
Definition: Cohort analysis measures success in mobile apps by measuring usage among groups (cohorts) of people who started using your app at different times.
For example, if you have just released a new app and want to see how quickly it is gaining popularity, you can divide the users into two cohorts:
Users who downloaded your app on release day.
Users who downloaded three weeks after release day.
The longer you wait after release day before breaking out cohorts, the more users will have time to try out your app and potentially get hooked. Thus, three weeks is a reasonable time to use for cohort analysis.
A typical cohort analysis would look at these two cohorts in terms of:
1. Weekly active users (WAU),
2. Monthly active users (MAU),
3. Total number of sessions per week, etc.,
Depending on what metrics are most important for your business.
For example, if you want to see how quickly an app is gaining popularity, you might look at WAU or MAU per week. In contrast, if you’re going to see how long people stick around once they’ve downloaded your app, you might look at the average session length per week or month.
Final Words
The mobile app metrics are highly affected by how much advertising or marketing you do and how good your product is at retaining users over time. However, understanding how many people stop using your app each week can help you make improvements to include more users over more extended periods.
The mobile app metrics are essential because enterprises want their apps to be used by as many people as possible. So, they can generate revenue from them and keep making new updates and features available for their customers.
Indian Mobile APP Developers can integrate an advanced dashboard into your app. Thus measuring all such metrics becomes convenient for your enterprise.


