
I recently developed a method to measure customer sentiment, the Customer Sentiment Index. This method combines a structured and unstructured approach to measuring attitudes. I’ve gathered evidence of the reliability and validity of this measure (also, see here,here and here), showing the usefulness of this measure for CX programs. In this post, I study the stability of customer sentiment (as measured by the CSI) over time.
Study
A B2B technology company included the open-ended survey question in their annual customer survey, “Using one word, please describe COMPANY’S products/services.” The Customer Sentiment Index (CSI) was calculated by applying our sentiment lexicon to each of the words provided for this question. CSI scores could range from 0 (negative sentiment) to 10 (positive sentiment). This survey also included a question that required customers to provide a rating on a measure of overall satisfaction (0 – Extremely dissatisfied to 10 – Extremely satisfied) and a rating about their likelihood to recommend (0 – Not at all likely to 10 – Extremely likely). The survey also included 12 customer experience (CX) questions that required customers to provide satisfaction ratings (0 – Extremely dissatisfied to 10 – Extremely satisfied).
The time period between these two survey administrations was about six quarters; the first survey was administered in the Spring of 2014, and the second survey was administered in the Fall of 2015.
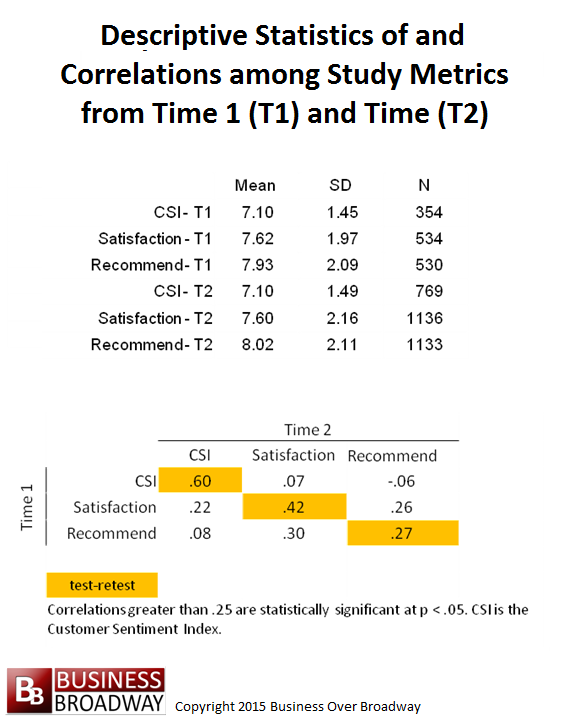
Descriptive statistics of and correlations among the study variables are presented in Figure 1. Average ratings did not change meaningfully over the two time periods for any of the three measures. The average sentiment rating was 7.10 for both time periods. A total of 68 respondents completed surveys from both survey periods. Consequently, the correlations in the bottom part of Figure 1 for CSI, Satisfaction and Recommend are based on samples sizes of 36, 68 and 67, respectively.
Stability of Customer Sentiment
The correlation between CSI from time 1 and time 2 was .60 while the corresponding correlations between the satisfaction and recommendation questions were .42 and .27, respectively. This pattern of correlations shows that customer sentiment is more stable over time compared to recommending intentions. People who reported positive sentiment at time 1 tended to report positive sentiment at time 2, while people who reported negative sentiment at time 1 tended to report negative sentiment at time 2. This pattern was less apparent for the recommend question.
Predictability of Customer Sentiment
Using the survey data collected at time 2, I found that satisfaction ratings with the 12 customer experience (CX) areas were more highly related to recommendation intentions (average r = .53) than they were with the CSI (average r = .29). This finding suggests that improvements in the customer experience will have more of an impact on improving recommendation intentions than it will on improving customer sentiment.
In a previous post, however, I found that CX questions were correlated with CSI across in different B2B companies at a much higher level (r ~.47). Also, it should be noted that the correlation between CX questions and recommendation intentions are likely driven by common method bias; both metrics use 0 to 10 rating scale, artificially inflating the correlations between them. I suspect that the true correlation between CX satisfaction and real recommending behavior is a lot lower than .53.
Summary and Conclusions
Customer sentiment, as measured by the CSI, appears to be somewhat stable over a long time period. In the current study, customer sentiment toward a vendor accounted for 36% of the variance in customer sentiment toward that vendor a year and a half later. While customers tend to report similar levels of sentiment over time, however, changes in customer sentiment are amendable to differences in satisfaction with the customer experience.
My research on the measurement of attitudes generally points towards the simplification of annual customer surveys. Over this past year, I tried to show the value of shortening annual customer surveys using the CSI. My goal in the next year is to advance this idea of simplifying annual customer surveys by helping leading edge companies improve how they measure attitudes. After all, in this Big Data world, businesses have many different data sources to measure how the business is running. By using operational, financial and operational data in conjunction with basic attitudinal metrics (i.e., CSI), businesses can efficiently capture, analyze and aggregate data in a customer-centric way to optimize value of all their data.


Question: Company to company, can’t this be somewhat dependent on internal and external circumstances which impact reputation, image, and trust levels? What comes up most immediately to illustrate the possibility is the state of mind among Target customers before and after the 40 million credit card info breach they suffered right around this time of year in 2013: http://www.bloomberg.com/bw/articles/2014-03-13/target-missed-alarms-in-epic-hack-of-credit-card-data
First, it’s great to see this kind of longer term research. Alas, the results are miserable.
If this was err…significant research, we’d call it test-retest reliability testing, and .60 is a complete failure of a) the instrument or b) the construct it purports to measure.
Since reliability is a necessary but not sufficient condition for validity of the measure, this evidence supports the hypothesis that the construct is not valid.
This kind of thing – questionable interpretations of data, is the norm for “research” in the customer arena (and many others too).
Since what you have is an unreliable instrument (no surprise there and completely predictable in advance), and thus one that is not valid either, there is NOTHING more that can be said, inferred or interpreted from this data.
Thanks for your comments, Michael and Robert.
Michael,
I agree that attitude measures are influenced by internal and external circumstances. If things change over time, that will be reflected in subsequent attitude ratings. That may be the reason driving the low correlations between the same constructs over time. A lot can happen in 1.5 years (the time between the two measurement periods). I would not expect a high correlation between the same measure over a significant period of time.
Robert,
In general, you can’t have a valid measure without it being valid. You make the mistake, however, of thinking that a test-retest reliability is THE measure of reliability. There are different types of reliability. I wrote about four of them here (http://businessoverbroadway.com/reliability-analysis-cem-program), including test-retest reliability. Each type of reliability tells you something different about the items/questions. I’ll mention two here. Internal consistency reliability tells you how good a given set of items are in measuring the same underlying construct. A test-retest reliability tells you how stable a score is over time.
Your blanket statement that a test re-test reliability of .60 is a complete failure of the instrument and the construct it purports to measure shows me you don’t fully understand or appreciate different types of reliability. By your standard, the satisfaction and recommend questions would be invalid because their test re-test reliability were so low (r =. 42 and r = .27, respectively). The low test re-test reliability only shows that attitudes are not stable over time; a dissatisfied customer at time 1 could report high satisfaction 1.5 years later. The same applies to sentiment and recommendation intentions.
Because the CSI is a single-item measure (for now), I don’t have any internal consistency estimates for this measure. I have tried to collect and present as much reliability and validity evidence as I could over the past year. The slideshare in this post provides a good summary of that evidence (http://businessoverbroadway.com/in-a-word-the-customer-sentiment-index).
The development of a measurement instrument is a scientific endeavor. This requires doing a series of studies that provide different ways of examining the instrument. My analysis above was one study to look at the stability of the CSI. You need to look at the preponderance of the evidence to draw conclusions about the instrument. Again, it sounds as if you put all your weight on a test-retest reliability score to draw your conclusion about “reliability” of this sentiment measure.
I’m quite excited about my research in this area. I’m not saying the CSI is the best measure out there. I’m simply trying to look for better ways of getting the attitudinal information we need through methods that are:
1. more efficient / cost-effective
2. appeal to a mobile-savvy customers (where texting is what they do)
3. respectful our customers’ time