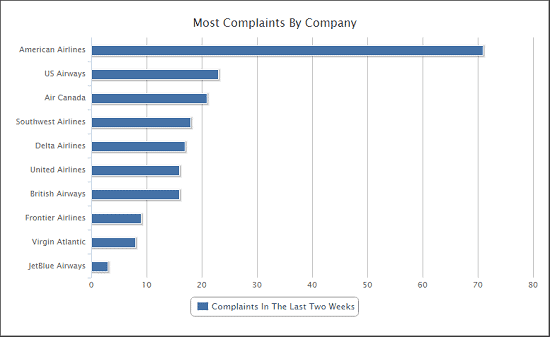
In this recent post by Fonolo American Airlines was hammered for having an outstanding (in a bad way) number of Twitter users complain about being on hold with them.
This got me to thinking:
How good is crowd data at predicting the Net Promoter Score for an organisation?
As it turns out it’s a pretty good indicator so let’s review it in detail
The chart shows that AA’s complaint rate is not just a bit above the other airlines but more than three times its nearest rival.

When examining the data the first thing that comes to mind is that maybe AA just has many more customers than any of the other airlines: more customers, more customers on hold, more tweets.
So, all things being equal the number of complaints could be expected to be related to the number of customers.
Let’s examine that hypothesis. Here we compare the On Hold hash tag rates with the number of passenger miles that each airline travels. (2012 data as reported by Nations On Line)

Well that shows almost no correlation at all. So, surprisingly, we can eliminate the number people as being a substantial driver of the high hold time complaints.
Of course, another possibility is that AA customers are massively over represented on Twitter relative to the other airlines in the sample. While possible, it seems unlikely.
Having eliminated those two possibilities we can see if perhaps on-hold mentions is a predictor of Net Promoter®. The NPS® data here comes from the Satmetrix 2014 Airline Industry Report.

Hold Time Complaints are a Goodish Predictor of Net Promoter Score.
This is a pretty good correlation. The higher the NPS the lower the number of on hold hashtags. Admittedly R2 = 0.29 is not a terrifically high correlation but considering that there are most likely multiple drivers for NPS and that this is a crowd level data it does seem pretty good.
However, and here is something really interesting, if you remove AA from the picture, the correlation jumps to 0.41. Now most people would admit that 0.41 is a pretty good correlation statistic and indicates that 41% of the variation in NPS can be accounted for by variation in On Hold complaint rate.
Put another way, simply counting on-hold hash tags is a pretty good way of predicting an airline’s NPS.

Maybe AA is an outlier — removing them improves predictive ability
Lastly, and we may be going too far here, if we also remove Southwest airlines from the sample set the R2 rate jumps to 0.95!

Without AA and Southwest the correlation is very high.
So what?
At this point we can draw a few tentative conclusions:
1. Crowd based data could be quite good a predicting important business metrics.
This approach would only really work well for large organisations because it requires a largish number of responses. It wouldn’t, for instance, work for the corner coffee shop. But it is a potentially useful way of ranking the NPS of large organizations.
Incidentally, this is not the first time that Twitter has been found to be good at predicting useful real work statistics so there is some precedence here.
2. When you’re down, a lot of people kick you.
As you can see the number of AA mentions is much higher than their overall NPS would indicate they should get. This could mean that their hold time is really very bad, but everything else is terrific, to balance out their NPS.
But this is seems unlikely and a better explanation might be that when people have a preconceived negative opinion they more quickly perceive service attributes negatively. There is good support for this perspective in this blog post on the halo effect.
So AA customers might be unfairly quick to pull the #onhold trigger.
3. Hold Time is a Pretty Important indicator of Customer Loyalty
Based on this information it would seem that hold time is a pretty good driver of NPS and therefore customer loyalty. This has the ring of truth about it and many organizations have validated this in their business.


