
Knowledge graphs are pretty hot these days. While this class of technology is getting a lot of market and vendor attention these days, it is not necessarily a new construct or approach. The core principles have been around for decades. Organizations are becoming more aware of the potential of knowledge graphs, but many digital leaders are puzzled as to how to take the next step and build business capabilities that leverage this technology.
As with many technology trends, what appears to be new actually has a great deal of history[1]. In a conference presentation, in April 2021, Juan Sequeda and Claudio Gutierrez discussed the history of knowledge and data representation and traced its chronology from the 1950s to the present day. They described how the building blocks and core principles of knowledge graphs have been in development for decades, and how the problem of making sense of unstructured information and linking it to structured data has been at the core of AI initiatives over that same period.
Evergreen Data Challenges
Every organization has challenges with all kinds of data. This includes structured data such as accounting information, transactional and operational data, process data, external data sources, data streams thrown off by digital experience and workplace technologies, customer behavioral data, manufacturing efficiency data, ecommerce data, and more. Integrating many sets of structured data into a meaningful picture has posed technical challenges. However, making unstructured content more usable and findable has been even more difficult, and very costly. Unstructured content includes a diverse set of documents, images, and explicit knowledge in the form of policies, procedures, manuals, troubleshooting, installation steps, product design, engineering diagrams, blueprints, and other “explicit” knowledge. Content management issues are persistent– they defy permanent solutions due to the emergence of new content types, the speed of information flows, the nature of technology evolution, and the dynamic landscape of marketplace change.
Over the years, the enterprise moved from formal ownership and centralized control of “documents” in the form of a records management function to completely decentralized creation and management of anything resembling a document, which wreaked havoc on records managers and the records management industry. Anything can be a record as anyone involved in “litigation holds” can attest.) The regulatory environment has also grown more complex, and official records of transactions, business processes, and business relationships are at the core of regulatory compliance, making their management all the more important.
The “how do I find my stuff” problem has grown more urgent over the years, and vendors in the search, content, and knowledge management space have tried to solve that problem by promoting their latest technical approach as the solution. Organizations say “OK, let’s try it – sounds like they have the secret sauce” and deploy the tools. Everything looks great and people can find their stuff… for a while.
Unfortunately, in their haste to stand tools up, management may have given little thought to the scaffolding needed for the information – the structure on which it is organized. Inevitably, the new shiny tool becomes filled with more and more content, but with inconsistent attribute and file naming, on-the-fly tagging, and other library science sins and transgressions. As the mess becomes untenable, the system that everyone once loved becomes the object of user scorn. “Our users hate_____,” fill in the blank. But really it is not the tool or technology they hate; it is the way it was implemented – without sufficient forethought to user needs and the situations in which they will need to use the tool.
Business leaders (or tech leaders, there’s no monopoly on bad decision making) decide that what is needed is a new tool. That other tool was not the right one. And here is a new one that they see a demo of, read an article about, or heard about from a colleague, and the cycle starts again.
Enter Cognitive AI
Cognitive AI, which seeks to emulate human thought and responses, reduces the cognitive load on humans, whether by providing natural language search, virtual assistants, or a personalized web experience with helper bots and chatbots. Some AI technologies are trying to make up for organizations’ past sins in poor design and information hygiene. The knowledge graph represents the information scaffolding of the enterprise that tells algorithms what is important and helps to address a lack of tagging in unstructured text.
Knowledge graphs can be defined from a couple of perspectives. Digital leaders understand that information must be organized in a way that helps customers find what they need, whether it is a product or information about how to solve a problem. Taxonomies are a way of organizing information (for example a product catalog for an ecommerce site) that groups products in a parent/child or whole/part structure (power tools/power drills/cordless drills). At the level of a product page, users can filter by brand, price, size, voltage, battery type, and more. These lists are defined using taxonomies and controlled vocabularies. Figure 1 is an example of a set of taxonomies that define the characteristics of cordless power drills:
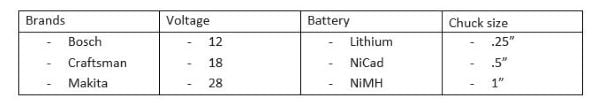
Each descriptor has a list of values, so that when the information structure of an ecommerce site is designed, multiple taxonomies are defined to create the digital experience.
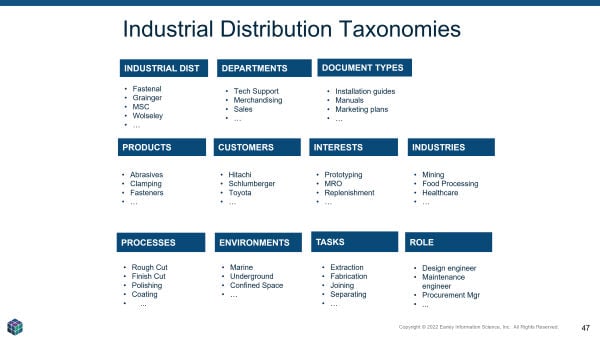
Relationships can also be built between taxonomies. For example, if one taxonomy describes products and another describes services, the availability of specific services for that product becomes a way to relate these two structures. For an industrial distributor, multiple taxonomies can be used to describe more than the products. The information domain contains many different elements, as shown in Figure 2.
When the relationships between the various taxonomies are defined, the result is referred to as an ontology. The ontology contains three types of relationships:
- Hierarchical: The traditional parent/child, whole part “is-ness” (this is a drill, a cordless drill is a type of drill).
- Equivalence: These are the non-preferred terms (the variations that people use that are not the “official” term — synonyms, acronyms, technical terms vs. layperson terms, code names)
- Associative: These are the conceptual relationships. A list of solutions can be related to a list of services “services for solutions.” Associative relationships are the “see also” relationships that one might see in a back-of-the-book index. Creating ontologies entails mapping these relationships.
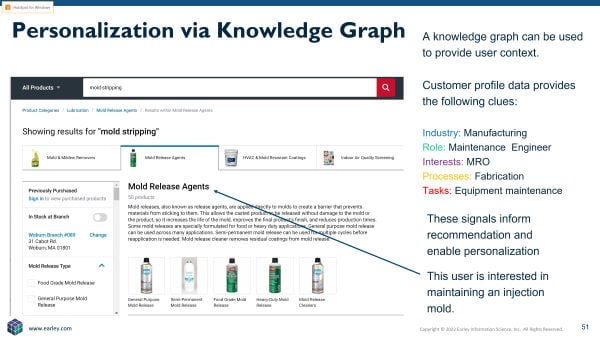
Extending the industrial example reveals additional possibilities. Understanding a customer’s industry can help prioritize certain categories. Understanding the role of a buyer and their interests further informs product recommendations. The recommendations may deal with particular processes, work in a specific environment, the need to accomplish specific tasks, and so on.
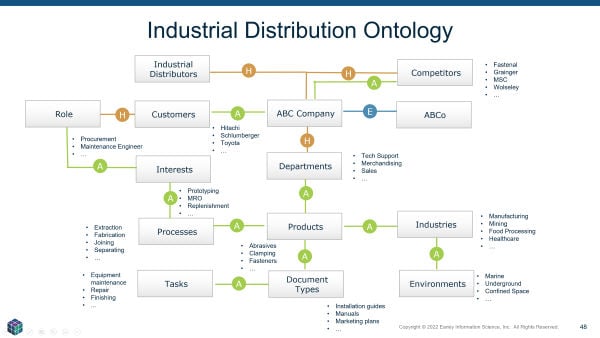
The ontology is the structure or scaffolding for knowledge, content, and data. When that structure is overlaid on top of data sources, the result is the knowledge graph.
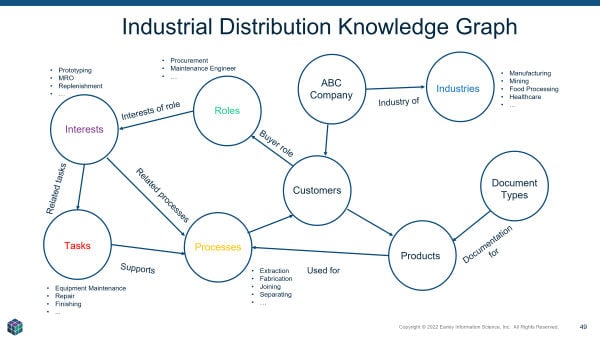
In Figure 4, a few of the entities were called out to show how they would be used to improve a product recommendation.
Imagine a user searching for the phrase “mold stripping” on an industrial distributor website. If the user worked for an injection molding company, they would likely be interested in the supplies needed to break down an injection mold. If the user worked in a real estate development company, they would more likely be looking for ways to remove mold and mildew from a surface. Understanding the interests, role, processes, or industry would provide the signals needed to surface the correct products for that user.
Taxonomies, Ontologies and Knowledge Graphs
Taxonomies: The official terminology that describes products, services, solutions, customers, documents, departments, markets, and so on – all of the concepts that are important to the business.
Ontologies: All the taxonomies that describe the organization’s world; i.e., the domain of knowledge and the relationships among them. For life sciences, the domain might include diseases, indications, drugs, drug targets, mechanism of action, and more. Relationships might include “indications for disease,” “drug targets for mechanism of action,” etc. For an insurance company, the domain would include policy types, classes of businesses covered, risks, and regions of operation, with relationships such as “risks in a region,” “policy type for class of business,” and on.
Knowledge graph: The ontology combined with organizational data. A knowledge graph presents the relationships among entities. Rather than providing analyses for quantitative data or other structured data as a traditional relational database would, a graph database focuses on connections, and presents them in visualized form. Therefore what becomes evident is the links between people, places, events, or other entities. Since it’s the relationship data that is stored in the graph database, analysis is much quicker than it would be for traditional analyses, which would typically require queries to be written across multiple databases to elicit these relationships.
And Your Point Is…?
Now we ask, “so what?” – This is where many knowledge graph projects get stuck. They are a great way to get a handle on data and content, but how do they produce measurable value for the organization?
It is challenging to identify hard ROI for data and infrastructure problems and projects. One organization I spoke with recently spent $500k on knowledge graph work with a services firm (not my firm) and when I asked about the ROI, the program leader said, “there is no ROI – we just had to get started.” Well, I would suggest that there should always be a business case and ROI even when exploring a new technology. In some cases, organizations will explore new tools without an ROI – this is part of the research and exploration necessary for finding new approaches and opportunities. However, they should have a use case to justify the experimentation. The “excuse case” can serve as a justification for making an investment that may have an additional payoff in other areas.
Collecting Customer Data – the “Identify Graph”
Knowledge graphs can be used to collate information about customer interactions across touchpoints, and that data can then be used to improve the user experience. Many organizations are beginning to develop their first-party data programs, which allow the capture of data and profile information from interactions across channels, devices, and touchpoints. The data exhaust from these interactions becomes the input to a knowledge graph for customer interactions. This is also referred to as an identity graph.
One advantage of a knowledge graph is its ability to map disparate data sources and structures together. Doing so with an identity graph through the use of a customer data platform (CDP) or other graph data platform allows for a 360-degree view of customer interactions and the ability to act on the customer’s “digital body language.”
Consider the advantages of this signal consolidation:
- Greater insight across the entire relationship when multiple divisions or business units sell to or service the same customer
- The ability to cross-sell and upsell based on customer past purchases, installed environment, and customer service interactions
- Improved personalization and product recommendations
- Improved efficiency of customer analytics programs
The customer identity graph version of the knowledge graph is essentially an attribute model for the customer. It provides customer-related information such as the types of content, products, topics, and processes they are most interested in as well as previous purchases and how they have interacted with the sales, service, or support organizations. This data is usually captured in a CDP and allows the real-time monitoring of the customer’s digital body language. In short, the clues and details they leave behind as they interact with various parts of the organization.
Knowledge Graphs Support Digital Transformations
Knowledge graphs have many applications in the enterprise. In addition to personalization, they can be used to catalog structured data sources, provide mechanisms to integrate disparate types of information, and allow for access methods that contextualize data (the “what happened”) with content and knowledge (the “why it happened”).
Knowledge graphs can also document data provenance, data quality, permitted usage, ownership, rights and governance, and change management processes. They enable the democratization of data by improving visibility into the data, along with appropriate access, without jeopardizing data policies. Using knowledge graphs to catalog and manage access to data also improves visibility into enterprise data, which enables more business stakeholders to use that data in support of business imperatives.
Knowledge graphs are not a silver bullet; they still require the blocking and tackling of good data management practices and proper data hygiene. They are a tool in the enterprise toolkit that supports many goals of digital transformation programs. Digital transformations are in fact data transformations. Building and maintaining the enterprise ontology and knowledge graph provides the data foundation on which transformation success depends.
Notes
[1]https://www.youtube.com/watch?v=_Qm2Xx0Itcshttp://knowledgegraph.today/paper.html


Excellent article Seth. You provide a very good explanation of why I have used Knowledge Graphs as the core of my EA framework, methodology, and tool design (enabling unified management of Mission Knowledge and Operations Lifecycle, Zero-based Budgeting (ZBB), Terminology, function, portfolio, and Configuration Management Database (CMDB )) since 1981, and now Zero Trust Architecture (ZTA), Identity Lifecycle Management (ILM), and, other organizational needs for unified management systems. It provides a holistic and multicentric metamodel or context model for any part or all of a mission or function.
It basically provides on expanded approach to unifying organizational, value-chains/supply-chains, and environmental data, information, knowledge, learning, awareness, decision support (full spectrum of analytics), and operational wisdom into an expanded form of CMDB to provide deep and dynamic operational performance guidance and support.
P.S. I first used this approach from 1982 to 1986 to manage the organization transformation of a large US Army organization (i.e., mission statement, leadership job descriptions, structure, staffing, job descriptions, equipment, IT network (servers, LANs, PCs, job-specific software), budgets, etc.) to its new mission requirements, much as you describe.
Thanks for the feedback. It sounds like you have certainly applied knowledge graphs across the spectrum of applications, processes and frameworks. Your experience validates the power and flexibility of knowledge graphs.