
A thorough eCommerce report needs to be precise, concise, and easy to follow if you want your customer experience to continue retaining audiences.
Reports shouldn’t be boring, nor should they gloss over essential facts in their quest for brevity.
That sounds like a lot to ask, but it isn’t impossible to create reports that are interesting, yet informative.
You can start by using report templates that are pre-formatted and pre-sectioned, which just leaves you with the task of filling in the necessary details and metrics.
Below, we will outline what information, elements, and graphics you need to include to create a comprehensive eCommerce report.
Essential eCommerce Report Metrics
The point of any report is to help businesses and teams understand where the company is at currently, and what needs to be done to retain customers.
This is why companies need to set out the customer metrics they will be measuring—and why these need to be defined before building the report.
eCommerce Audience Statistics
Most organizations know early on which customers will be attracted to their business products and services. But this audience is subject to change over time.
In this section of the report, website teams should aim to examine customers who have completed purchases; they should create survey forms to gather this information.
The questions should relate to basics, while also going into more granular details:
- Age
- Location
- Gender
- Job role
- Interests
- Frustration points
- Preferred products
- Preferred communication channels
Conduct this exercise on an annual basis so your eCommerce report reflects the concurrent status of your customer base.
eCommerce Customer Acquisitions
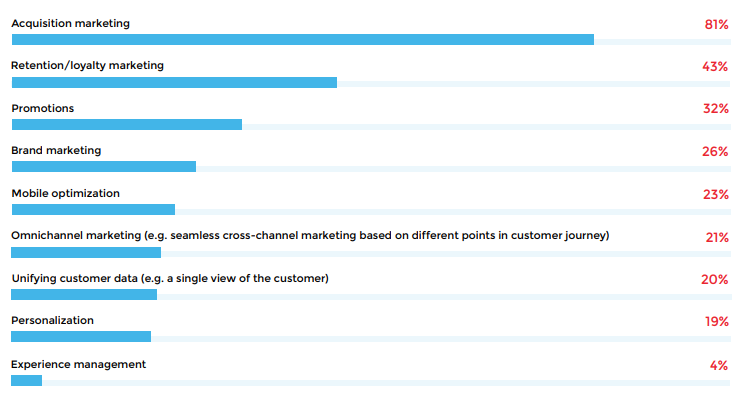
You can also use survey forms to find out how your company is acquiring customers. This is crucial to understanding which channels you should be spending your time on.
According to a recent survey, customer acquisition analysis is imperative to eCommerce marketing:
There are numerous ways customers could potentially find your website:
- Organic search
- Social media
- Online ads
- Chatbots
- Direct-link clicks
- Newsletters
- Corporate partnerships
Some of these channels may be outperforming others, and those are the ones you should be focusing your efforts on to draw in more customers.
Customer Behavior on eCommerce Platforms
Your eCommerce report should analyze the way your customers and site visitors interact with your website. Some customer behaviors businesses can study include:
- Length of time spent on pages, especially product pages
- Page bounces—how often customers leave a page without acting
- How long before a customer makes a purchase
- Whether a customer returns to your site to make another purchase
This is the kind of information that will help you understand how or why customers are buying from you—and what you still have to do to improve purchase rates.
eCommerce Site Conversion Rates
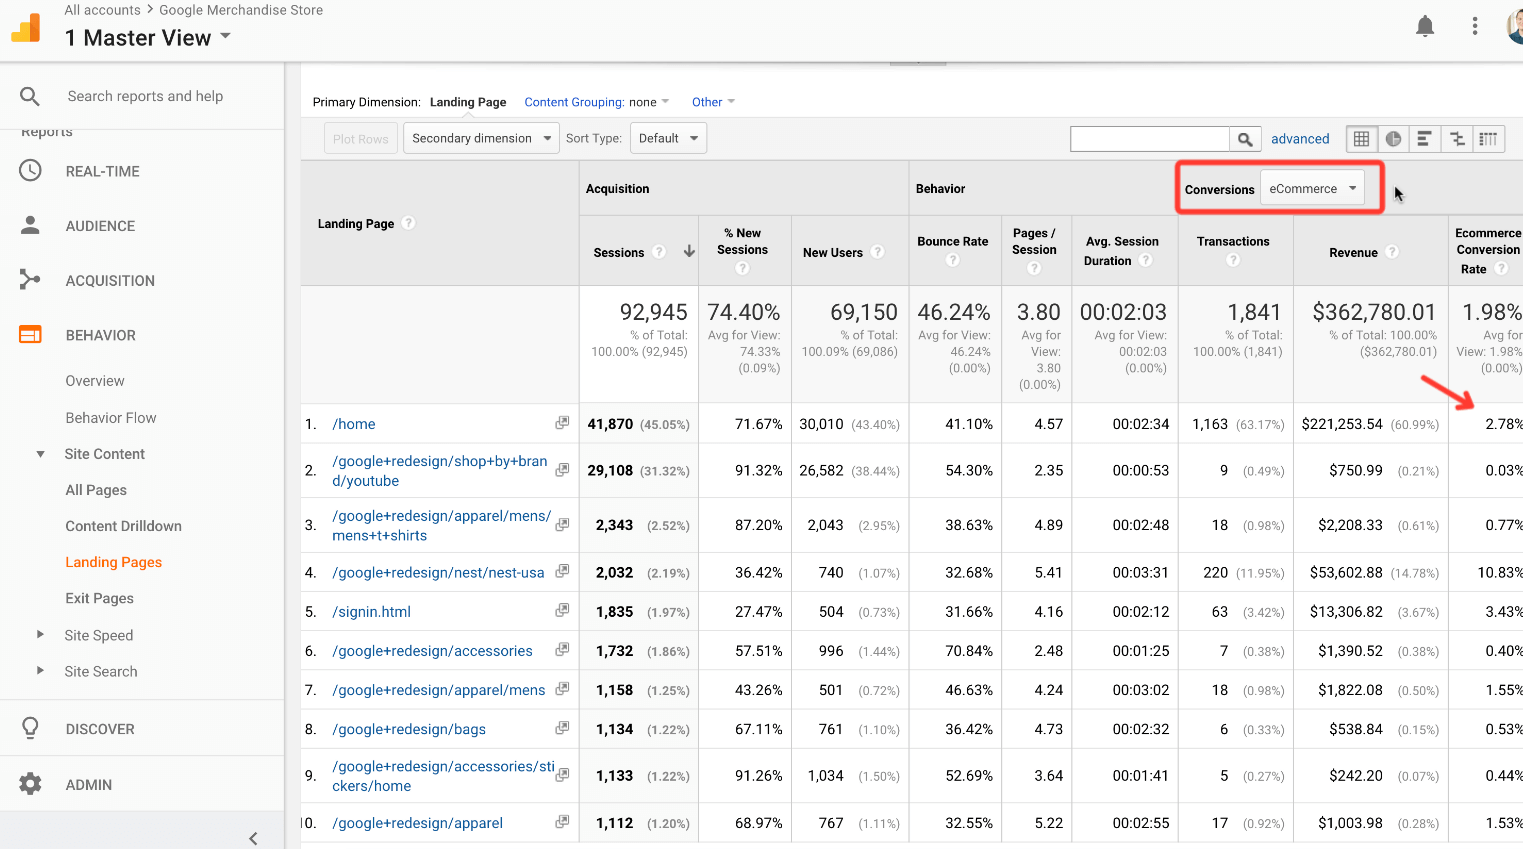
Examining eCommerce data is vital for growing your business and for understanding the behavior of your customers because they impact your site conversion rates.
Conversion rates can be gleaned from Google Analytics, as in the example below:
To do this, you need to consider the following metrics:
Sales conversion rates
It isn’t enough that customers are visiting your eCommerce site and buying products—you also need to know how often they visit and whether that correlates to regular purchases.
If people are visiting your site often but not buying anything, that may mean your website needs to be better optimized to encourage them toward the checkout.
Average Order Value
The size of the orders placed by your customers also shows how they relate to your business.
Are they buying into the subscription models, accessories, or making bulk purchases? Use upselling techniques to attract large purchases if AOV is falling short of parameters.
Macro conversions
Alongside improving AOV, companies need to examine whether customers are expanding their brand relationship beyond purchases. Are they following the brand on social media, looking at multiple products and accessories, or subscribing to the newsletter?
Cart abandonment
Do customers add items to the cart but fail to checkout? Cart abandonment metrics need to be included in your eCommerce report to ensure steady sales.
Incomplete checkout rate
Similar to cart abandonment, businesses need to know whether customers fail to complete the checkout phase. This could mean the process is too complicated, leading to abandonment.
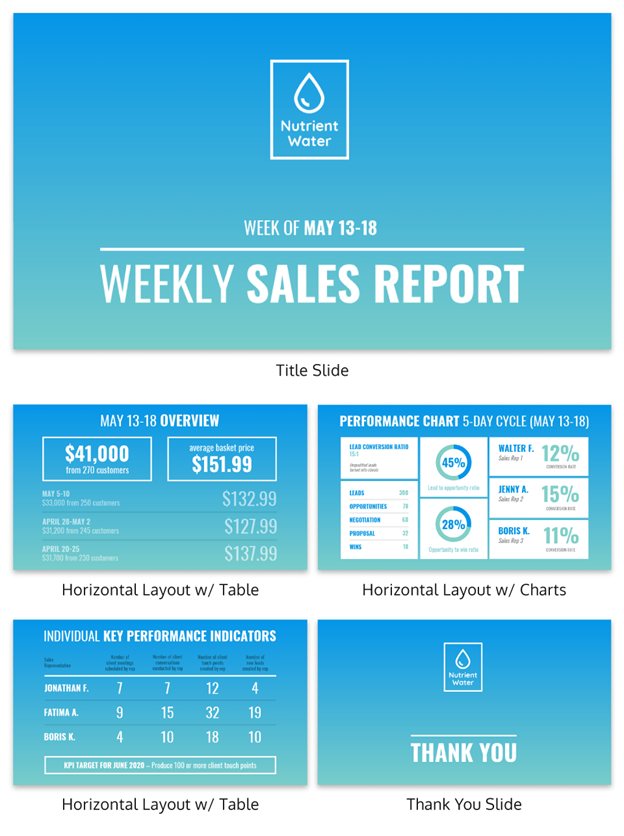
Layouts for eCommerce Reports
A great layout for your report will make it easier to read and to absorb the information contained within.
In this eCommerce expense report, the layout is simple and clear, making it easy to understand.
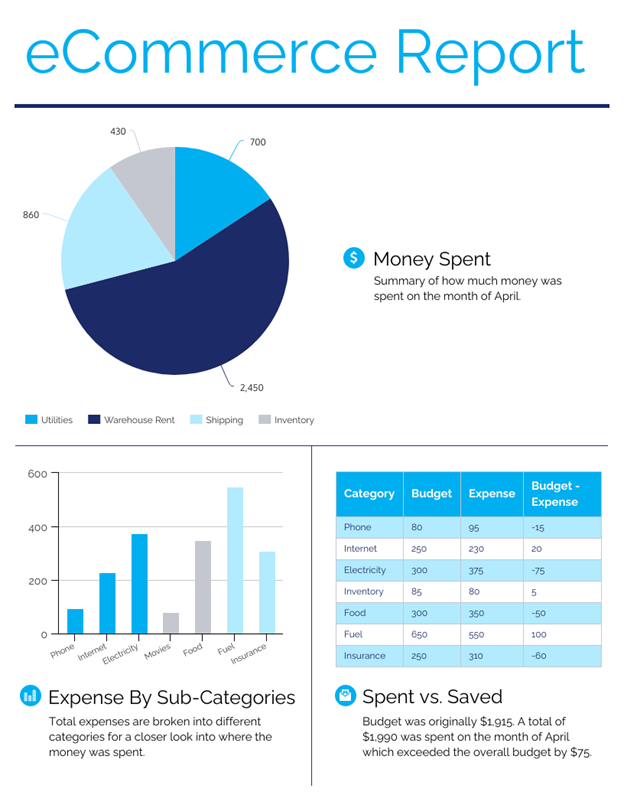
Source: Venngage
- Keeping your report design free of clutter helps readers absorb the information quickly.
- Incorporating white space around elements like text boxes, headers, charts, and visuals makes the data stand out clearly.
- The more information you need to share, the more pages you will need—it is best not to crowd everything into a single page because you will confuse the recipients of the report.
When creating a multi-page report, it is important to vary your layouts—overusing the same design across several pages will make the experience monotonous. However, using too many layouts can be disorienting, so group your topics and assign layouts accordingly.
Writing eCommerce Report Headers
Your eCommerce report should have a clearly-defined header with a headline that explains what the report is for.
Consider including visuals that augment your message—a report on finances can include illustrations of notes and coins, while one on sales can include an image of a chart.
But headers don’t function solely as a descriptor for the report—if you have sections within your design, each should include a header that explains what readers can expect to encounter.
Using the Right Charts in eCommerce Reports
Ecommerce reports need to include data, and while you can write a short paragraph with insights, you have to remember that your report won’t be read so thoroughly.
A large number of people receiving your report will be skimming through it, which is why you need to make the information and data quick and easy to absorb.
That is why data visualization is necessary—charts and graphs share succinct data points with the reader, capturing the essence of the information in a glance or two, like in the chart below.
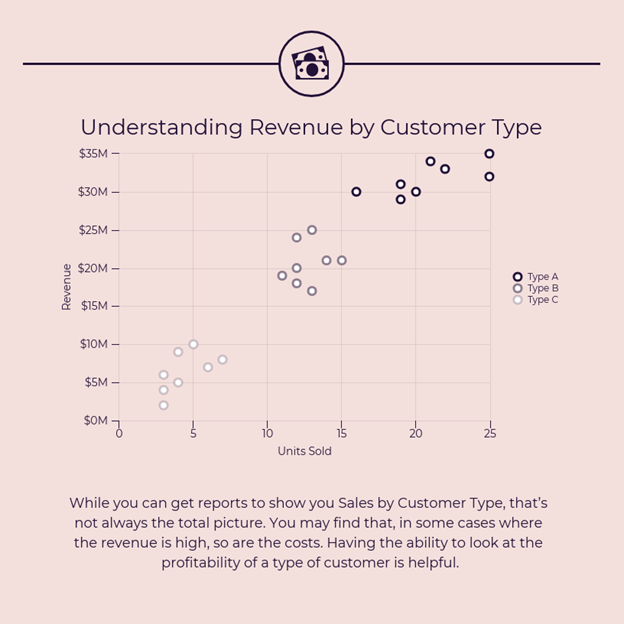
Source: Venngage
These visualizations also make the report skimmable and memorable, which is what you’re aiming for.
How to Use Color in eCommerce Reports
Don’t underestimate color when it comes to creating reports, and using brand colors is necessary to align your report with your company’s ethos.
The way you use color can also improve readability, but incorporating one color for every element in the report will make it difficult to understand the importance of elements.
Instead, adopt color hues for your headers, body copy, and charts, like in this project report example which uses blue, green, and white to share all the necessary details.
Source: Venngage
The color scheme is used not only to differentiate elements from each other but also to draw the reader’s attention to the most important information on the page.
Font Use in eCommerce Reports
As with colors, choose fonts carefully when you design an eCommerce report.
Brand fonts should be the established choice because, once again, brand recognition is paramount, even in a document that is circulated internally.
It’s important not to use too many fonts—two to three is enough to establish a hierarchy between the headers, subheads, and body text.
More than three fonts could make it difficult for your readers to follow.
Also, keep in mind what kind of font weights you are using—making something bold or italicizing it could make the font look completely different and take you over the two-to-three limit.
eCommerce Report Visuals
You also need to consider the visuals when you are creating a report. There are numerous kinds of visuals you can use in eCommerce reports, including:
- Charts and graphs
- Icons
- Stock images
- Infographics
- Product photos
This social media report includes multiple visual elements—a background image, icons of social platforms, and charts.
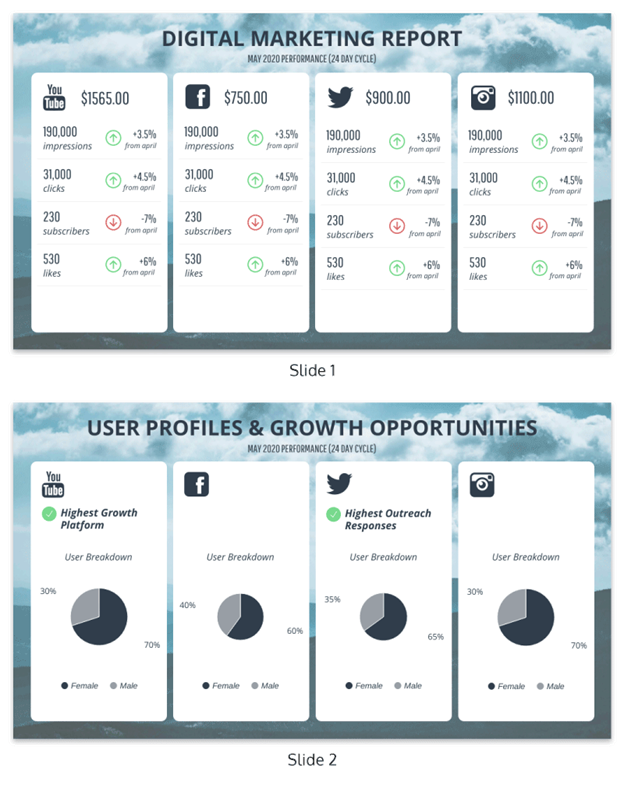
Source: Venngage
All these visuals help clarify the message, make the report skimmable, and ensure recipients retain what they read in the document.
Key eCommerce Report Takeaways
Creating a comprehensive eCommerce report requires planning and a fair amount of thought needs to be put into who is receiving it.
Here are the essentials elements you must include in the report:
- Measurable metrics
- An easy-to-read layout
- Headers that define sections
- Data visualizations
- A color scheme that complements the message
- Two to three fonts to establish an informational hierarchy
- Visuals to highlight information
Now you have all the essential tools you need to start building your report.


