
A knowledge base is a great way to help customers find the answers they need before reaching out. When done well it can save your team many hours of answering simple questions. It also requires a significant investment. Writing knowledge articles is a time-consuming process that can take hours or even days of work.
To make the most of this investment any support or knowledge team needs to keep answering these two important questions:
- Is my article helping customers? Do they find the answer they need here without contacting us? How can I make it more helpful?
- What is the next article that I need to work on? What other customer questions can we answer with a helping article? How often these questions occur?
From a quality perspective, there are a few best practices to consider. These include advice on how to structure an article or how to write helpful descriptive paragraphs. Make sure you follow them to produce clean, concise, and user-friendly content.
But how do you measure the success of an article? And how do you know what to work on next? These are a few metrics you can use to answer the questions above. A simple, data-driven approach to creating and improving your knowledge base.
Customer searches
Simply looking at what customers are searching for but are unable to find can be a source of inspiration. When customers are trying to find an answer and fail, it means one of these two things:
- There is no article that answers the customer’s question. If people are looking for things you haven’t addressed, it may be worth writing an article to answer their questions.
- The article exists but cannot be found using the search terms used by the customer. These terms can be misspellings or synonyms not included in the article. Adding these terms into the keywords section of the article will make it available for future similar searches.
Most helpdesk platforms that include a Knowledge Base offer a way to extract and visualize failed search terms.
Direct feedback from customers
It is likely that a new article will have snippets of information missing. When covering a complex topic or describing a workflow, it is hard to anticipate and cover all the edge cases. Also, there might be certain sections that are clear for you but confusing for customers. Allowing them to ask questions and submit feedback will give you the insights you need to improve the documentation. Again, most knowledge base vendors should provide a way to enable comments and feedback on articles.
look at what questions customers have when they contact your support team and mention one of the knowledge base articles
Also, look at what questions customers have when they contact your support team and mention one of the knowledge base articles. Or when they follow up from an article shared by one of your team members. They usually do this because the article didn’t help with their question or problem. As soon as you get the follow-up questions, update the content so that future customers with similar questions will find the answer they need.
Page metrics
Tracking common web metrics for each article in your knowledge base will help you understand how good it is at helping customers. Each metric by itself won’t tell you much, but looking at all metrics can help put together a story.
Page views
Usually, you want this metric to be high and trending up over time. It indicates that more customers are able to find the article and read it.
This is not always the case as too many page views might indicate a problem somewhere else. For example, if your article on Pricing is having too many hits, investigate why is that the case. Is the pricing too confusing on your website?
Bounce rate
A “bounce” is when someone visits a page and then leaves without taking an action, such as clicking on a link or filling out a form. The bounce rate measures how often this happens on any particular page. In marketing, a high bounce rate is bad news, but in support, a high bounce rate on an article page is a good sign. It means customers found the answer after reading your article, so they stop browsing and get back to their work.
in customer support, a high bounce rate on an article page is a good sign
On the other side, a high bounce rate on the help center home page is bad. It indicates customers can’t find the articles they need to answer their questions.
Average time on page
You want the customers to spend time on the page reading your article. Low values of this metric point to a problem. It can be that the content is not relevant to their question or that it is confusing and they stop reading after the first paragraph. If that’s the case try to collect more direct feedback to help you understand what is wrong and fix it.
User flow analysis
Page metrics are helpful, but understanding the entire customer’s journey as he or she navigates through the knowledge base is extremely valuable. It can help you get a bigger picture of what needs to be improved.
A user flow report offers key information on how customers are interacting with your help center by exposing the journey they take during their visit. Not just what articles they read but also how they get to the article and where they go from there.
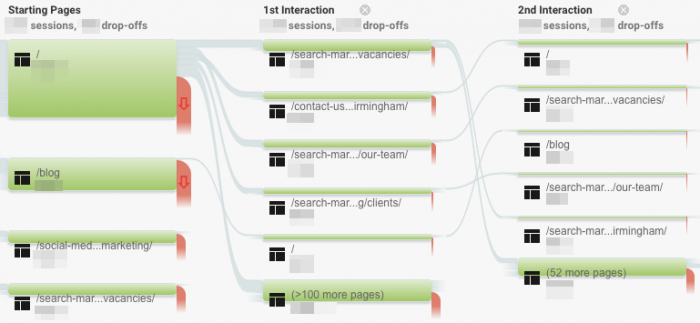
Such a report displays a graphical representation of where customers start, the pages that they visited, and where they left your help center.
Things to look out for in a user flow report:
- High drop-off rate on the search results page.
- Movement between high-level sections of the knowledge base without landing on a particular key article.
- Customers landing on the contact page after visiting the help center. What articles did they read before that?
- Searches which lead to the right article, yet still end up as support tickets.
- Compare the user flow for different segments, like mobile and desktop users.
a user flow report offers key information on how customers are interacting with your help center
Although user flows are not usually part of the offering of knowledge base or helpdesk vendors, they are available with third party user analytics tools such as Mixpanel or Google Analytics.
Helpdesk data
The helpdesk platform that your team uses to communicate with customers is home to valuable information. Not just the customers’ complaints and questions, but also how your team is responding.
These are a few examples of data you can use to decide what to work on next in your help center:
Commonly used saved replies
If your support reps are using saved replies frequently when responding to customers, you can turn those replies into short articles that answer the customers’ questions. This way they will have the opportunity to find the answer themselves instead of reaching out.
Common issues seen in support conversations
When available, the top reasons customers are contacting your support team can guide you into what the next article should cover. Not all reasons can be answered with an article, but some of them should. Make sure your team is tagging each conversation correctly and granularly or use a conversation analytics tool to help you with this.
Conversations with long handle times
If your support reps are spending more time than usual on certain conversations, it might be because they refer to complex topics. Some of them cannot be self-served but other might be with detailed documentation. Check if any of these topics can be covered with a helpful article.
Articles frequently recommended in support answers
It’s a great practice to coach your team to share knowledge base articles in their responses to customers. It’s not just helping them answer the customer questions quicker, but it can also give you additional insights into what improvements you can bring to the help center.
picture the journey a customer has to get to the article and look out for friction points
If you find that your team recommends certain articles frequently, ask yourself why aren’t the customers finding the articles themselves. Try to picture the journey a customer has to get to the article and look out for reasons why they are not able to. Where is the friction? Is it the web site navigation? Or the right search terms not being picked up?
Watching for trends
Ideally, you want any change to the knowledge base to bring improvement and help customers more. But how to measure that?
Article metrics
For each article, check out the page metrics trend over time. You should see the number of page views go up as customers find their answer more often. In the meantime, the number of support conversations on the related topic between your team and customers should get lower over time. If you made any improvements to the article, keep an eye on the average time on page and the bounce rate, and make sure they improve as well.
Overall, these are some global metrics to watch out for.
Self-service Score
This metric represents a great way of summarizing how good your knowledge base is at helping customers self-serve. The self-service score is calculated by dividing the total number of unique visitors in the help center by the total number of customers with tickets. This allows you to get a better idea of how many visitors are trying to self-serve before submitting a ticket.
Ratio of number of searches per new conversations created
The more customers are visiting the help center to search for answers to their questions, the less likely they will contact your support team. This ratio should increase over time as you work on the knowledge base. If the trend is downwards, there might be something going on that needs further investigation.
Customer contact rate vs. knowledge base visits
These two values combined are often seen as representative of the overall health of a self-service system. The customer contact rate is the percentage of unique customers contacting support in a period of time out of the total number of active customers. As you gradually introduce and improve a knowledge base, this metric should decrease while the number of visits to the help center increases.
Keep At It
A great knowledge base can help you boost customer experience and improve retention. All this while taking some burden off your support team. But you need time and perseverance to make an impact. Although you might get a few quick wins at the start, most improvements will be gradual and take a significant amount of dedicated work.
Never stop asking yourself: did adding an article, changing the content, or restructuring it has made a positive impact? Where possible use an evidence-based, data-driven approach to answer these questions.
Gathering the data presented in this article requires gluing together many platforms. This can be a complex technical challenge. This is why at Swifteq we decided to build a knowledge base analytics app that helps support teams measure the success of their help center.


