
Retention marketing is about preventing your valuable customers from churning. Reducing customer churn requires you to know two things: 1) which customers are about to churn and 2) which remedies will keep them from churning. In this paper, I show you how marketers can improve their customer retention efforts by 1) integrating disparate data silos and 2) employing machine learning predictive analytics.
Your marketing strategy is only as good as your ability to deliver measurable results. In our world of Big Data, marketers no longer need to simply rely on their gut instincts to make marketing decisions. Through the application of data science principles, marketing professionals now have a way of making evidence-based decisions to improve their marketing activities. In this paper, I will demonstrate how marketers can leverage all their data to make fact-based decisions about how to decrease customer churn.
In this Big Data world, a major goal for businesses is to maximize the value of all their customer data. Most customer data, however, are housed in separate data silos. While each data silo contains important pieces of information about your customers, if marketers don’t connect those pieces across those different data silos, they are only seeing parts of the entire customer puzzle. Integrating information/facts about your customers allows you to gain an understanding about how all the variables work together (i.e., are related to each other), driving deeper customer insight about why customers churn, recommend you and buy more from you.
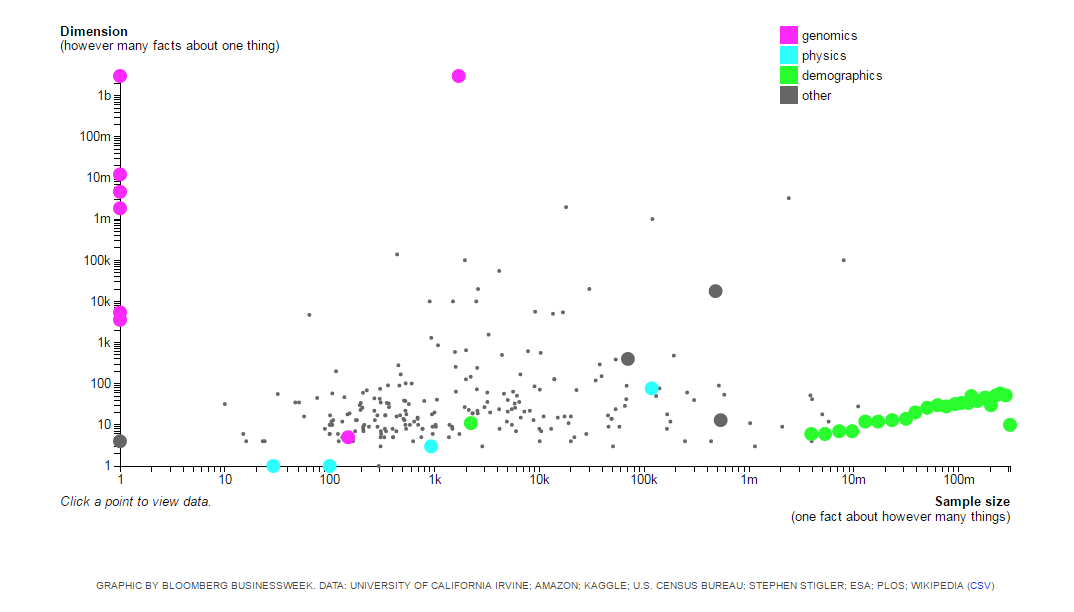
Figure 1. Data sets can be described by two characteristics: 1) the number of entities you have (i.e., sample size) and 2) the number of facts you know about each entity (i.e., number of variables).
You can describe a data set (silo) along two dimensions: 1) the sample size (number of entities in the data set) and 2) the number of variables (number of facts about each entity). Figure 1 includes a good illustration of different data sets and how they fall along these two size-related dimensions (For the interested reader, check out the figure in an interactive graphic).
For data sets in the upper left quadrant of Figure 1, we know many facts about a few people. Data sets about the human genome (see human genome project) are good examples of these types of data sets. For data sets in the lower right quadrant, we know a few facts about a lot of people (e.g., US Census). Data silos in business are good examples of these types of data sets.
Mapping and understanding of all the genes of humans allows for deep personalization in healthcare through focused drug treatments (i.e., pharmacogenomics) and risk assessment of genetic disorders (e.g., genetic counseling, genetic testing). The human genome project allows healthcare professionals to look beyond the “one size fits all” approach to a more tailored approach of addressing healthcare needs of a particular patient.
Siloed data sets prevent marketers from gaining a complete understanding of their customers. In this scenario, marketing analytics can only be conducted within one data silo at a time, decreasing your model’s predictive power / increasing your model’s error. The bottom line is that you are not able to make the best prediction about your customers because you don’t have all the necessary information about them.
Data Integration as your Customer Genome Project
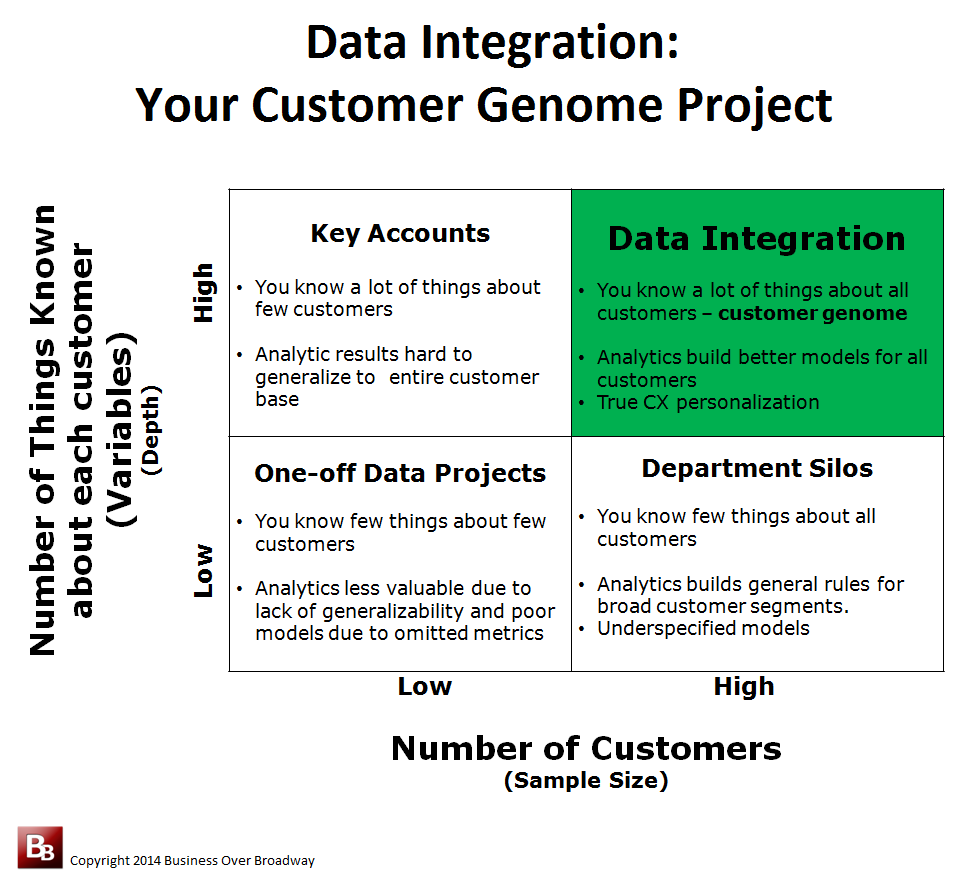
Figure 2. Data Integration is an exercise in creating your customer genome.
Using the 2×2 graphical approach to understanding data size (i.e., number of customers and number of variables), we can see how the value of your integrated business data is greater than the sum of its parts. Figure 2 illustrates these two components of size by examining four different scenarios of how businesses use their data. In the lower right quadrant, it is business as usual; data are housed in individual Department Silos. When departments keep their data in their own data set, each department only knows a few things about the customers. The lower left quadrant (One-off Data Projects) represents one-off projects where a sample of customers is used to study a phenomenon. Analytics in these types of projects may be less valuable due to lack of generalizability (to the other customers) and poor models (e.g., underspecified) due to omitted metrics. Data projects that fall under the Key Accounts quadrants are ones where you know a lot of things about a few “important” customers (Accounts). In these situations, analytic results of a small set of accounts may be difficult to generalize to the entire customer base.
Integrated data sets (those in the upper right quadrant) allow you to know a lot of things about all your customers. Analytics applied to these types of data help you generate better predictive models because your integrated data contain all the key variables that are useful in predicting customer churn.
Using these “customer genomic” type data sets to build your predictive models, you are better able to target specific customers with personalized treatment that resonates with them (i.e., segmentation on steroids). Consider the marketing manager who needs to help a specific client who is about to churn. The more information this marketing manager has about this client, the better able she is to tailor messaging to address that specific customer’s problems.
Machine Learning and Predictive Modeling of Customer Churn
Once you have integrated all your data silos, the next step is to use predictive modeling to identify the variables (often called features) that are predictive of customer churn. Because these integrated data sets are so large, you are simply unable to quickly sift through the sheer volume of data manually. Instead, to identify key variables and create predictive models, you can now rely on the power of machine learning to quickly and accurately uncover the patterns in your data.
Iterative in nature, machine learning algorithms continually learn from data. The more data they ingest, the better they get. Based on math, statistics and probability, algorithms find connections among variables that help optimize important organizational outcomes, in this case, customer churn. Coupled with the processing capability of today, these algorithms can provide insights quickly to improve marketing functions that keep your customers loyal.
Building Your Churn Model
While there are many standard algorithms for building a model – logistic regression, random forest, support vector machine (SVM) and Bayesian inference, the ultimate goal is to minimize our error in prediction (decrease type I and type II errors. To build the churn model, you first use training data sets and validation sets to build the initial models, and then you cross-validate those results to verify the robustness of the model. The output of this step is a model that is used to assign each customer a churn score that indicates each users’ likelihood to churn. At this point, you can extract a list of users who are at risk of churning by choosing a churn score cutoff e.g. greater than 0.80.
Churn Labels and Drivers
In the process of developing an algorithm to predict customer churn, you examine a couple of things to improve targeting and segmentation in marketing campaigns. First, you can add a churn label to each user to easily see their predicted churn status (e.g., Danger, Red, Yellow or Green). Additionally, you add the top three machine learning features that correlate with risk of churn to each user. For example, an at-risk user Bob with churn score of 0.90 will have a churn label ‘Danger’ and churn drivers such as “Stuck in onboarding” or “No activity in last 5 days”.
Summary
Marketers are relying more on the use of data to improve how they communicate with their customers to prevent them from churning. Your customer insights are limited by the variables used in your modeling and your analysis of those data. Because each data silo contains only a small part of what defines your customers, analyzing silos separately leads to suboptimal models. Additionally, machine learning allows you to interrogate your data efficiently. By knowing more about your customers (the variables and how they are related to each other), you can build better, more comprehensive, predictive models which ultimately allow you to have a deeper understanding of your customers, providing you with insights about ways to decrease customer churn.


