
80% of companies are under the impression they deliver great customer journeys.
They even use taglines like, “we put our customers first”…
Statistics show that while many businesses think they rock, they are under a false illusion. And who says so? Why, their customers of course, because only 8% out of those 80%, think the company’s customer service is tops!
The stat hath spoken.
Heatmaps remove perception and provide reality.
Let’s get into it.
Why the false perception?
Firstly, why do 72% of companies believe they provide a good customer experience when they don’t? Why are they under this false perception?
It’s simple really: they think they understand customer service, but they don’t.
That’s because until recently, customer service has always been known traditionally as a soft skill. This is an incorrect attribution, because before the customer experiences the soft skills in the journey, they have to experience the infrastructure.
The full customer journey involves all the touchpoints where the service “touches” the customer via materials, a process or company representative. This includes:
• Branding and marketing materials
• Any interaction with the business, be it a phone call, email, message via social media and so on
• Operational processes
• Company standards and procedures
• Company culture
• Training of staff
• Surveys
The best way for companies to identify these touchpoints, is to put themselves in the customer’s shoes and think of every single way a customer gets “touched” by the company.
Instead, what usually happens, is that the company revolves around their processes, their culture, their standards, when all the time, the customer’s needs are what should be driving Every. Single. Thing.
Heatmaps show reality
As far as online customer journeys go, heatmaps are a powerful method to strip perception and show what’s really happening on the website. A heat map is an analytical tool that provides insight as to:
• What elements get the most attention
• Where visitors click (that aren’t links)
• How much time is spent where
• See what visitors see, and what they do on your site
• Where customers drop off your site
• How customers fill in your site’s forms
• What visitors like and don’t like
Heatmaps visually highlight the areas that get the most attention and maps out clicks.
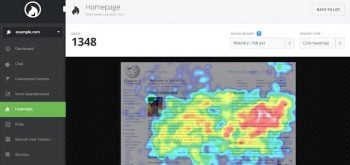
This screenshot from Hotjar demonstrates aa heatmap in action. The “hotter” the area, the “hotter” it really is.
How to use what you find
A big problem many companies have with analytics, is not knowing what to do with the information once they get it.
While heatmaps are the easiest way to analyze the effectiveness of your website as far as visitors go and getting them to do what you want them to do, the tool itself is just an enabler; its the business that has to implement actions for what they find.
So how to use what you find from heatmaps?
Clicks that aren’t links
If you find that people are clicking on things that are not links (could be an image, text, or whatever else), do either one of these two things:
1. Make it into a link
2. Don’t make it look like a link.
Areas that get the most attention
With this heatmap feature, it’s easy to design pages that are effective because they have the visitor in mind. For example, you may want to move a form to an area that gets the most attention, or if for instance, an image is getting all the attention, move it to where the form is.
What should get the most attention, is the area that holds the activity you want the visitor to do.
Scroll maps
A scroll map shows how far down visitors are scrolling down before they ditch, and this tells you which content should go where – the more important the content, the higher it has to go on the page, before the user drops off the site.
ConversionXL says, “Scroll maps can also help you tweak your design. If you’ve got strong color changes, that means that people think whatever follows is no longer connected to what came before (called “logical ends.”). These are sharp drop-off points that are hard to see with just Google Analytics.”
Recorded replays
Heatmap technology allows you to record a video of your visitors to find bottlenecks and problems.
For example, where do customers give up? Or watch how they complete forms or see what they do on a badly performing page.
Conclusion
While many companies are “winging” it, there are tools available that are easy to use to analyze behavior. Heatmaps remove the guesswork to show the journey your customer really takes when visiting your website.


