
3 steps to boost your Customer Experience strategy and make it truly customer-centric.
By Peter Fader and Sarah E. Toms
Picture this: Your CEO signs on at the beginning of the day, but before she checks emails or the stock market, she glances over a colorful dashboard showing a variety of customer metrics, compiled real-time from customer data collected the day before. It’s a slick looking interface with a rollup of key performance indicators, based on industry best practices—displaying how customers view their relationship with the company, and what they think of their offerings. Metrics such as the Net Promoter Score (NPS)®, customer satisfaction score (CSAT), CX Index®, and customer effort score (CES).
Sounds pretty impressive, doesn’t it? Surely having this capability describes the gold standard of Customer Experience (or CX) measurement that all companies should be aspiring to monitor and manage on a daily basis? It would be nice if this were true, but in most real-life cases, we see the execution falling short. Most companies, including the one we describe above, are taking shortcuts with their customer metrics in ways that ultimately hurt their business strategies.
How can we tell? There are trigger words that all executives and managers should avoid like the plague. These include “rollup,” “aggregate,” “average,” and any use of a single metric to represent all customers. Taking the average of anything is a gross over-simplification that pulverizes information about important cross-customer differences into a homogeneous glob, rendering the data presented on those sexy-looking dashboards to be practically useless. Worse yet, decision-makers are lulled into a false sense of security, thinking they’re making data-driven decisions about what their customers want or need because, well, “look at all that data!” The problem is that if they’re using aggregate CX metrics to make decisions, this data isn’t providing an accurate view of their customers.
There’s no such thing as an average customer and, therefore, there should be no such thing as an average customer metric.
If you’ve read our book, The Customer Centricity Playbook: Implement a Winning Strategy Driven by CustomerLifetime Value (CLV), this idea of customer heterogeneity won’t sound new to you. Recognizing and celebrating customer heterogeneity is the core principle of customer centricity, and represents the first principle in our Customer Centricity Manifesto. In our book, we discuss tuning your acquisition, retention, and development tactics to the varying CLVs, while working to integrate CLV cross-functionally across your organization and with your external partners. CX was one area we didn’t get into too much detail about, so we’d like to take a deeper look here.
According to the Interaction Design Foundation, “Customer experience (CX) refers to a customer’s experience with a company or brand, at all touchpoints. A touchpoint is any way by which a customer can interact with a brand, such as when purchasing or using a product or through seeing commercials featuring it.”
But it isn’t always clear which metrics are best to measure CX. In Forrester’s CX Index®, CX is measured across two dimensions: CX Quality and Customer Loyalty. CX Quality is calculated using effectiveness, ease, and emotion. Customer Loyalty uses advocacy (or NPS®), enrichment, and retention. In this article, we refer to these scores generally as CX metrics. (While companies like to look at multiple CX metrics for the average customer, we prefer to look at how a single CX metric varies across the customers – that’s where meaningful insight and actionability arises from.)
How do we correct the problems with CX measurement practices and make the resulting strategies more customer-centric? Thankfully, you’re only three steps away from achieving this goal.
Step 1: Maintain heterogeneity of your CX metrics
Have a chat with the folks crunching your CX metrics to figure out a way to manageably maintain the heterogeneous makeup of the scores representing your CX quality and customer loyalty. It’s more useful to know the distribution of scores from bad to great, or detractors to promoters, and not simply that average customer satisfaction went down by 0.6. By avoiding over-simplified shortcuts, you’ll be able to zero in on what’s truly happening with your different customers, especially if you take the next step.
Step 2: Analyze CX metrics against other factors, such as switching costs
Using the more detailed data about the varying CX scores from the last step, try plotting these values against other factors that aren’t merely slight variations on customer happiness. We advocate careful consideration of the switching costs of your customers. This will make the CX metric itself more relevant and should also provide some hints about how to action these newfound insights in more targeted ways. We like the use of switching costs when analyzing CX metrics because it measures another form of friction that your customers are experiencing, thus making them more or less sticky.
To get a better understanding of the stickiness switching costs can cause, consider Investopedia’s definition:
… the costs that a consumer incurs as a result of changing brands, suppliers or products. Although most prevalent switching costs are monetary in nature, there are also psychological, effort- and time-based switching costs.
Given this broad financial and psychological definition, not all of your customers have the same real or perceived switching costs, even if they’re on the same contract as each other. (There’s that pesky heterogeneity, once again!)
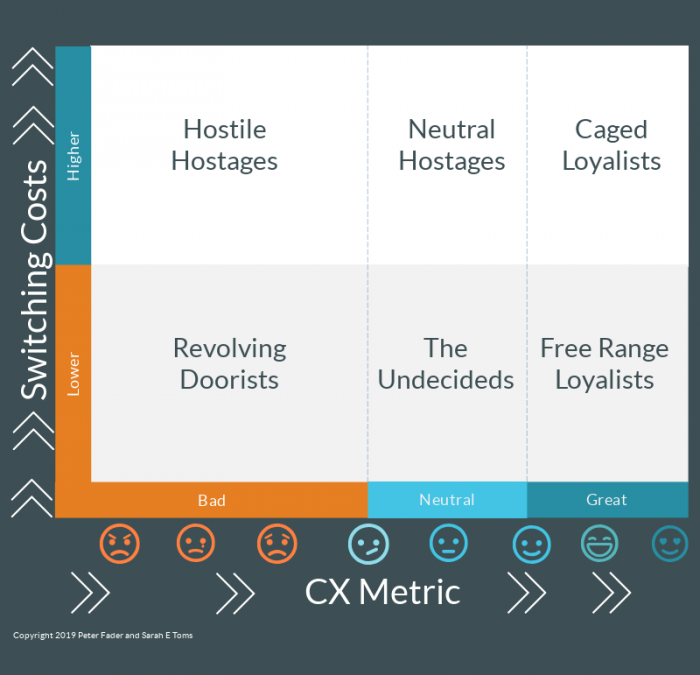
In the chart below, we’ve simplified the concept, showing customers classified by switching costs and a CX metric. Laying it out in this way provides a more nuanced view of your customers with regards to retention, loyalty, and the role of CX. In other words, on a scale of hate you to love you, do customers have a choice about whether to stay or go, and depending on this answer, what should you do about it?
Step 3: Deploy CX tactics with precision to gain maximum returns
Rather than engaging with customers generally and investing in broad CX initiatives that will never land perfectly with every customer, you can run targeted experiments to measure the effectiveness of your various CX tactics. Here we lay out some good starting points for fine-tuning how you target CX, but keep going with these ideas to see what’s delivering the best results for your organization.
Let’s start with those Hostile Hostages in the top left. They’re trapped, and they’re not happy about it. Maybe they’re in this situation because there’s very limited competition (Hello? Cable company?), and the alternatives wouldn’t be much better, or maybe it’s too risky or too much of a hassle to switch to a competitor. Whatever the reason, these customers are just plain miserable–even if they appear to be “loyal” based on their long tenure. In this situation, we recommend focusing your CX strategy on the higher-value hostiles (preferably based on Customer Lifetime Value) to see if there are ways to move them positively on the CX scale. For example, strategic account management can be an effective way to make life better for higher-value customers and can often turn those frowns upside down. But don’t fool yourself into thinking you can turn all your hostile hostages into raving fans, nor should you try to—especially those with lower CLVs.
The Revolving Doorists are more than likely here today but gone tomorrow because they’re dissatisfied and switching costs are low–so sayonara baby! These customers probably have low CLVs, and there’s probably a disproportionally large number of them in your customer base. This means their low CX scores are tipping the scales toward the negative when aggregated with higher CX metrics from other smaller clusters of customers. We talk about a phenomenon in The Customer Centricity Playbook that relates to this group called “The Paradox of Customer Centricity,” in which we explain that you shouldn’t ignore this large, low-value segment of your customer base but you must not over-invest in them either. This sage advice extends to your CX investment in these customers, as well. To this end, think about lower-cost, higher-throughput options like customer service and loyalty programs—that when done right, will raise the stickiness rates without breaking the bank.
Shifting to the top middle and right of the chart: The Neutral Hostages and Caged Loyalists are stuck with you, and they range from feeling meh and apathetic to feeling full-on Stockholm syndrome about you. Especially true of the Caged Loyalists, remember that there are going to be far fewer of these kinds of customers in your ranks, and they’re hardest to find and acquire in the wild. Don’t chase them around or get in their way, but do think about ways to reduce any perceived friction they may be encountering. In other words, target your CX strategy in a way that keeps them highly satisfied while they’re trapped in captivity.
Moving to the bottom right, the Free-Range Loyalists are not locked in and could decide to go to another provider anytime they choose. But they’re not, which means this flock probably has a high CLV. This group is keeping you on your toes. Relax, keep your wits about you, and figure out how to keep your competitive edge. For all your loyalists, whether caged or free-range, developing the right premium service is often a good approach. These offerings simultaneously help to maintain your competitive edge while providing something that they have an appetite to purchase, thus making these customers even more valuable (and potentially more willingly locked-in than before). For many professionals, LinkedIn’s premium services are a good example in this regard.
Last but not least, let’s not forget about the Undecideds, even though they could easily forget about you if given the chance. Again, try to separate customers with higher potential or actual value from the lower-value ones in this category, then look at the CX tactics we recommended for the adjacent clusters of customers. The goal is to make sure to make the right level of investment—without getting too carried away—to heat up this lukewarm group of customers, even if only by a few degrees.
Follow these three simple steps, and your company could be well on its way to taking more accurate measurements of CX, actioning those insights more effectively, and making CX strategies more customer centric.

Sarah E. Toms is executive director and cofounder of Wharton Interactive. She is a demonstrated thought leader in the technology field, with over two decades experience working in a wide variety of industries. Sarah has built award-winning edtech teams that develop highly engaging games and simulations, and she co-invented simpl.world, an open-source simulation framework. Follow her on twitter at @SarahEToms.


An aphorism I like is “statistics aren’t facts, they’re interpretations.” Obviously, that has stuck with me and it jumps to mind every time I read a statistics-laden sentence beginning with the word Shockingly . . .
That’s how I think of averages, whether they express mean, median, or mode. Same for dashboards, or anything else that’s measured in business, for that matter. The numbers compiled always represent a personal or algorithmic interpretation of a situation or condition, often drawn from a large data set. Like a lot of business information, the problem isn’t inherent in the calculation itself, but in its use or application. For that reason, I can’t malign using averages per se, just the logic people use to draw meaning from them.
In my work in risk management, range volatility is almost always an operational consideration. Averages have a purpose, but in my view, they are a weak proxy for what is actually happening. The sets [10, 20, 30] and [19, 20, 21] both average 20, but if I were doing a quality assessment by measuring output consistency from a stamping press, set #2 appears more favorable to me. In this instance, averages alone are too reductive. Without knowing set ranges and standard deviations, for example, I cannot make informed decisions for improving quality.
But aggregated information such as averages are valuable for many business decisions, particularly in marketing. If my business strategy is to increase customer share of wallet, I will include average revenue per order as part of my regular marketing information. If I’m a process manufacturer with thousands (or hundreds of thousands) of end items or blends, I must consolidate my selling information. It is not practical or even useful to look at pricing or revenue on a per-item basis. Instead, I will roll up or average all unit prices and net sales for a product segment. This was a top deliverable I was asked to provide for one company I worked for.
My purpose is not to dismiss or diminish the value of using granular data. A service dashboard might track average duration for customer incident resolution, but without dissecting the detail of the service requests, a declining average might be interpreted as a false positive signal.
So when it comes to using dashboards, averages, roll-ups, aggregations, and detailed transactions in identifying and mitigating business risks, I recommend ‘yes’ to both. As long as they are used in a mutually supportive way.
Pete and Sarah -The section in your post which most resonated with me was where you explained the Switching Costs/CX Metric customer personas: “Laying it out in this way provides a more nuanced view of your customers with regards to retention, loyalty, and the role of CX. In other words, on a scale of hate you to love you, do customers have a choice about whether to stay or go, and depending on this answer, what should you do about it?”
This is where behavioral economics, in particular the emotional component of CX, is extremely powerful There is a metric/KPI, or more appropriately a multi-question framework (not an index) that will help sustain and continue to improve customer experience and value delivery. That framework is customer advocacy behavior: Advocacy is built on positive perception, active purchasing and a strong and supportive, vocal bond with a supplier, selected from all those that might be considered. With advocacy, you could readily identify the granular rational and emotional factors driving such personas as Hostile Hostages, Caged Loyalists, and The Undecided.
Hate and love, what I’ve interpreted as Alienation/Sabotage and Advocacy have always been pretty much central and core to CX. Going back almost ten years, I endeavored to set the table in CustomerThink for the marketing and customer-centric value of customer advocacy measurement: http://customerthink.com/marketing_case_customer_advocacy_measurement/
Completely agree that, to be truly actionable, CX metrics must be customer-centric, and ideally stakeholder-centric. In my work, a good portion of how customers behave toward, and bond with, a supplier has to do with employee commitment – to the company, to the product/service value proposition, and to the customers themselves. Employee commitment, which we define as ambassadorship, is a way of understanding customer effect that transcends both satisfaction and engagement. It directly influences customer advocacy, the range of love and hate in the relationship