One of the most difficult issues to get to grips with in Customer Experience is employee culture. Yet without gaining an understanding of where the blockages are in your organisation towards customer centricity your initiatives could end before they even begin. So how do you get to know, who believes in what? One way is to ask employees directly, but there is always the risk that in order not to feel that they are ‘being difficult’ they will say one thing but do another.
In a test piece of research, Beyond Philosophy undertook an analysis to see whether corporate perspectives on the Customer Experience could be teased out to see which employee cohort had similar beliefs to each other and which were separated from the group.
To do this we used specialist techniques from psychology that deep-dive into the subjective perspectives of the individual. This is very important in an employee context as the CEO clearly has a much stronger pull on decision-making than say a marketing executive.
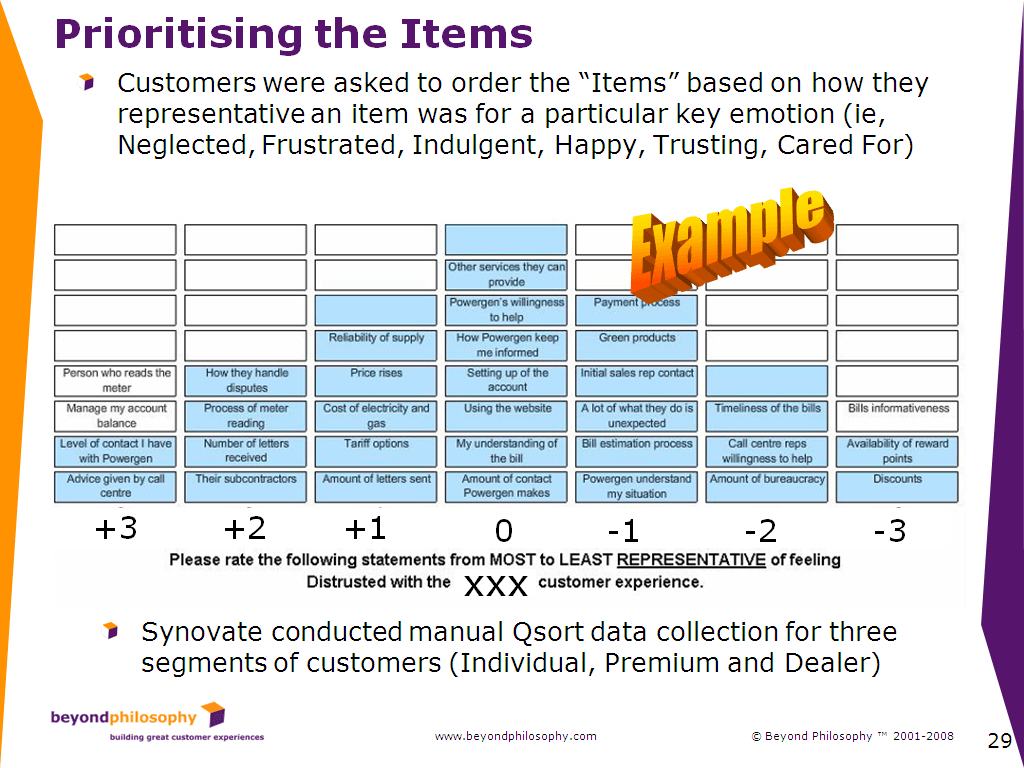
To execute our research we used a technique from psychology called Q-Methodology. Here we asked employees to order by importance 29 experience ideas developed by the board. Clearly the board had their own ideas of what they wanted to do, but they wanted to test whether this was consistent with broader employee views.
The following is an example of the approach:
The extraordinary thing about this method is that because of the number of permutations of the above card sort, it only takes a small sample to determine if there is a significant pattern in the data. This enables a more granular level of analysis, by individual employee and department, than normally allowed for by other statistical methods. Hence, we can start to see how employees are similar or dissimilar in terms of mindset.
To illustrate this point, consider how if we used just 28 cards we would have the following number of permutations of card sorts.
Validation of the Method
Q Methodology maybe new to many readers, so here is a summary of statements on its use from Wikipedia:
Measuring the psychology of the individual
Q Methodology is a research method used in psychology and other social sciences to study people’s “subjectivity” — that is, their viewpoint. Q was developed by psychologist William Stephenson. It has been used both in clinical settings for assessing patients, as well as in research settings to examine how people think about a topic.
Measuring the psychology of the group culture
Q method supports Cultural consensus theory – a framework for the measurement and evaluation of beliefs as cultural; shared to some extent by a group of individuals.
Q method is different from traditional research techniques
Normal factor analysis, called “R method,” involves finding correlations between variables (say, height and age) across a sample of subjects. Q, on the other hand, looks for correlations between subjects across a sample of variables. Q factor analysis reduces the many individual viewpoints of the subjects down to a few “factors,” which represent shared ways of thinking. It is sometimes said that Q factor analysis is R factor analysis with the data table turned sideways.
One salient difference between Q and other social science research methodologies, such as surveys, is that it typically uses many fewer subjects. This can be a strength, as Q is sometimes used with a single subject.
Our results
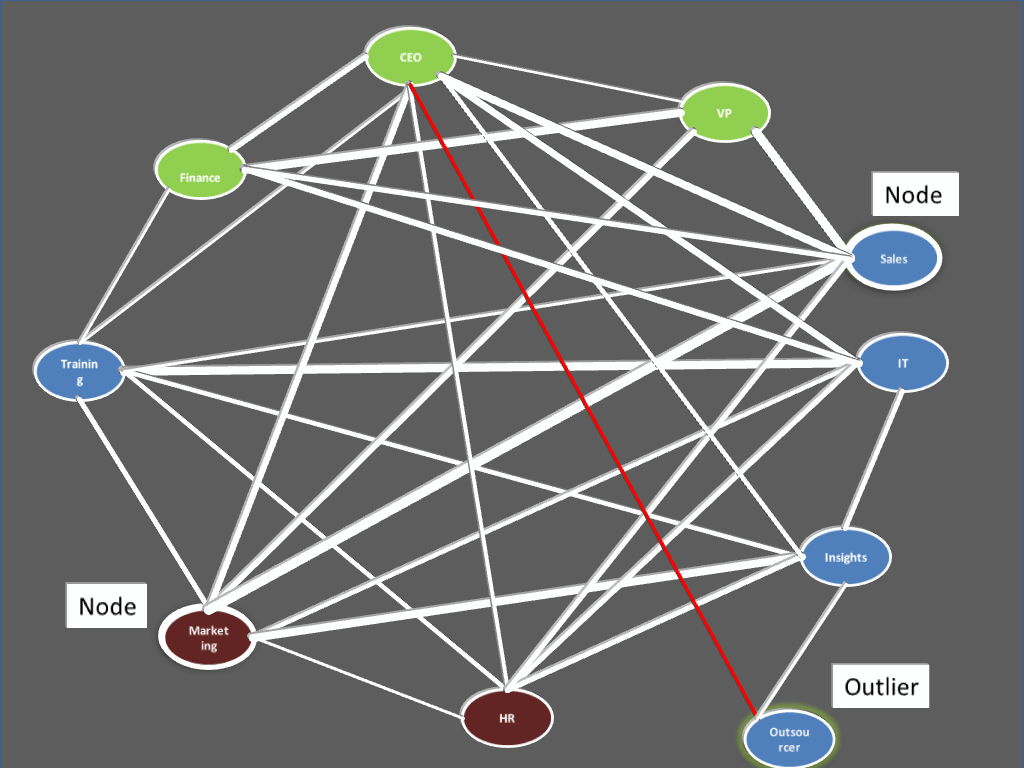
The Power Map below indicates from a research sample within one professional services firm how each cohort related: the strength of lines indicate the strength of agreement on what the company’s Customer Experience should be.
How Employee Cohorts relate
From the map above we can see that:
- The CEO’s mindset on the Customer Experience is only weakly related to the VP’s and Finance – this indicates some problems in future execution
- Outsource provider’s to the business have a completely different mindset and in fact hold an opposite view to the CEO – this will be a key barrier to overcome in any execution (these are the outliers)
- Sales and Marketing act as huge influencers in the business and are strongly in cahoots – without their support nothing will happen (they are both nodes)
- Insights is virtually ignored, except by Marketing
- IT seems oddly related to Training – perhaps there are friendship networks going on that may act as a barrier to action
Who is the most Networked?
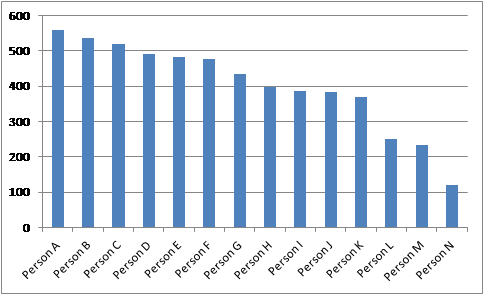
From the same data we can start also see which group or persons are most networked
And, how close or similar different people or employee groups are to certain key individuals. Here the distance in terms of similarity of perspectives towards the Customer Experience is shortest between person A and B.
Power Maps are quick to perform – taking around 10 minutes for employees to complete online or face to face. They reveal deep and rich data that can help a business understand the power relationships in a business and what actions need to be performed to get buy-in for any initiative.


….isn’t it more useful and actionable to understand what employees think is being delivered to the customers in terms of perceived value in the experience, relative to what the customers actually think they are receiving?
This is employee ‘mirroring’ research, and it is built from the SERVQUAL Model, developed by Professor Leonard Berry and two colleagues in the mid-1980’s. They wrote an entire book about the benefits and applications ot this conceptual approach. Essentially, SERVQUAL identifies the perceptual and knowledge gaps between what customers want, what the organization understands (or doesn’t understand) about this, and what they actually receive (http://www.istheory.yorku.ca/SERVQUAL.htm). For the past three decades, this approach has been effectively utilized to bring employee behavior, value delivery processes, and customer pereption of experience more into alignment.
Having conducted scores of mirroring studies, in b2b and b2c industries around the world, my assessment is that it is an excellent, and quite HR-friendly, research tool for optimizing customer experiences and customer advocacy behaivor. It is also highly beneficial for employees. The technique makes employee communication, training, incentives, and even hiring practices far more targeted than more traditional staff research. It can identify beliefs and attitudes, on a rated and/or prioritized basis, relative to what is important to customers, and how well experience components are being delivered; and this can be done at the individual employee, group, departmental, location, and overall enterprise level.
This has been addressed in several of my books, and CustomerThink blogs, including one which has been read over 11,000 times and tweeted almost 140 times:
http://www.customerthink.com/article/linking_employee_behavior_to_customer_loyalty_advocacy
http://www.customerthink.com/article/employees_dont_know_what_customers_value
Michael Lowenstein
Michael
(Q) isn’t it more useful and actionable to understand what employees think is being delivered to the customers in terms of perceived value in the experience, relative to what the customers actually think they are receiving?
(A) The focus of the article was on a singular use of the technique – in terms of understanding internal beliefs towards the experience – in terms of a comparison between internal beliefs and external that could be a use of the technique as well.
(Q) SERVQUAL: For the past three decades, this approach has been effectively utilized to bring employee behavior, value delivery processes, and customer pereption of experience more into alignment.
(A) Michael – I know what SERVQUAL is. If your point is 'use this model' and no doubt 'this wrap around technique' fine. Q method differs in that SERVQUAL uses normal factor analysis to find correlations between variables across a sample of subjects. Q looks for correlations between subjects across a sample of variables. Q reduces the many individual viewpoints (or perspectives) down to a few 'factors' which represent a shared way of thinking.
In this sense we are talking about different things. In Q I am looking for shared perspectives among a group or often small cohort of employees. In SERVQUAL the intent is not to look for shared perspectives but correlations between variables.
Q is more about the shared subjective perspectives of the group. Because it can also deal with small sample sets (and hence is a quali-quant method) it is also useful where you want to define say how the CEO's perspective differs in a quantifable manner from other employee cohorts.
(Q) This has been addressed in several of my books, and CustomerThink blogs, including one which has been read over 11,000 times and tweeted almost 140 times:
(A) Michael – well if you wish to believe that, believe it. As I say SERVQUAL is answering a different question. I have nothing really to say about some of these academic methods, at the end of the day what is more important is the context of the situation and your ability to interpret the results. Models like SERVQUAL are useful aids to thinking not truth.
…but about the gap which SERVQUAL addresses, but doesn’t really cover in the research, namely the perceptual differences on key elements of value delivery as seen by two key stakeholder groups, employees (by function, location, etc.) and customers. Also, correlation analysis/simple regression, even at a high R squared level, can be misleading. Companies are looking for the causation roots, i.e. what is positively driving and undermining, or otherwise negatively affecting, delivery of value. Very often this is found within one of three elements (or sometimes multiple elements): employee attitudes and actions, customer experience processes, and level of cultural customer-centricity.
(Q) …but about the gap which SERVQUAL addresses, but doesn’t really cover in the research, namely the perceptual differences on key elements of value delivery as seen by two key stakeholder groups, employees (by function, location, etc.) and customers.
(A) This is not unique to SERVQUAL. At least in BP the standard approach is to understand perceptual differences by stakeholder functions. I would agree look at both sides of the equation to see the differences in understanding…… However, a company can also take a different opinion and lead the customers towards their answer just as much as vice versa….look at Apple.
So I tend to agree with you, understand the approach to value delivery between customers and employees. But any toolkit can do this, Rep Grid, Q Method, PLS… but the philosophical difference is that backward looking modelling is only a partial answer. Data should be informative of a creative solution. So value delivery is also about giving space to trial and error based on what executives believe could be a great solution i.e., gut feel.
(Q) Also, correlation analysis/simple regression, even at a high R squared level, can be misleading.
(A) Agreed, in BP modelling approach we do not rely on correlation or linear regression. Further there is a major failing in all quantitative research that assumes drivers of value equate exactly with what people desire i.e., what is driving value from today's experience is the same as what is in customers minds about what they would like. This failure point we also address amongst many others.
(Q) Companies are looking for the causation roots, i.e. what is positively driving and undermining, or otherwise negatively affecting, delivery of value.
(A) Agreed, the closest you can get in SEM based modelling is the strong application of theory and looking out for Simpsons Paradox. But you should never only depend on a model, otherwise to quote Henry Ford, customers would have just received a faster horse. Quants can help understand a problem but it is never truth and the one thing that annoys me is data wonks crushing creative potential. The only truth is what happens in the market.
(Q) Very often this is found within one of three elements (or sometimes multiple elements): employee attitudes and actions, customer experience processes, and level of cultural customer-centricity
(A) Maybe, depends what you mean by each element and the circumstance of the company. This looks fine to me but risks being a tautology, ‘very often it is found in everything that the customers experiences and the company does’. No-one can disagree with that. This is the challenge for CE, to avoid becoming a theory of everything.