
So far we have learnt how to make attribute trees, and how the market research data or desk study data (which we call scores) can be obtained. Further, we understood this data is shown as a ratio, and the Customer Value ratio (the ratio of the worth of your products and services or your value score divided by the worth of your competitor’s products and services) is called Customer Value Added. Likewise, each item has a relative importance, and we have showed these items on the attribute trees.
The scores tell us what we should do, improve, hold or communicate to the Customer on how good we are. The relative importance and the scores determine the priorities.
- Measure and diagnose the Perceived Value in comparison with market competitors. The metrics can be used for building Action Plans that will impact market share and profitability – where Customer Value Foundation can facilitate this changing process.
- A “Value Tree” is developed based on inputs from interviews with end users and stakeholders. From the Value Tree (Perceived Cost-Benefit Tree), a list of major attributes is generated in order of impact, where attributes with competitive advantage is can be used for “communication” and attributes that need to be improved can be used for improvement action plans.
- With a list of Perceived Attributes to improve, CVF experts with client’s executives will study internal metrics that best correlate with the attributes and set objectives for improvement, timing and leaders. This is the baseline for the Action Plan phase.
- The increase of Perceived Value generates improvement in market share and profitability, according to our experience with more than 3,800 cases in the last 14 years.
To understand this best, we will start again from basics:
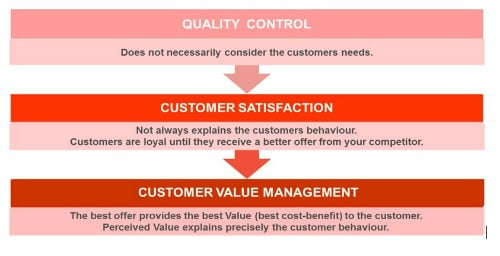
You can see that Customer Value Management is the result of management evolution from QC to Customer Satisfaction to Customer Value (Figure 4.1). So becoming a Customer Value expert gets you to be on the cutting edge of management and among the select elite experts in Customer Value.
Fig 4.1 Evolution of Management Concepts
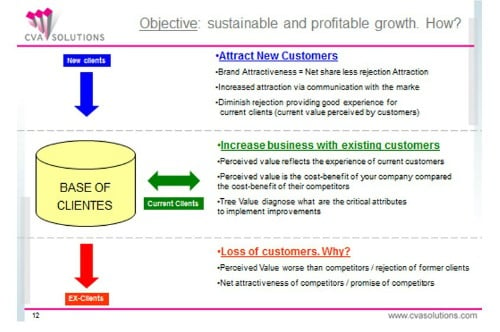
 Customer Value Added has a host of important tools to attract new Customers, increase business with existing Customers. This is shown in the next chart
(Figure 4.2)
Customer Value Added has a host of important tools to attract new Customers, increase business with existing Customers. This is shown in the next chart
(Figure 4.2)
Fig 4.2 Customer Value Added Tools
You have already learnt what Customer Value Add means (the measure of Customer Value)
CVA Calculation
We had learnt earlier to make attribute trees. Here we show how the Customer Value scores can be put on an attribute tree and the relative importance of each of the attributes are also shown on tree. Remember, how you got the relative importance or weights of each of the attributes? We get these through statistical analysis of the data. The weights are derived through analysis (and are not stated by the Customer). See Fig. 4.3
Fig. 4.3 CVA of Attributes (Internet Provider Example)
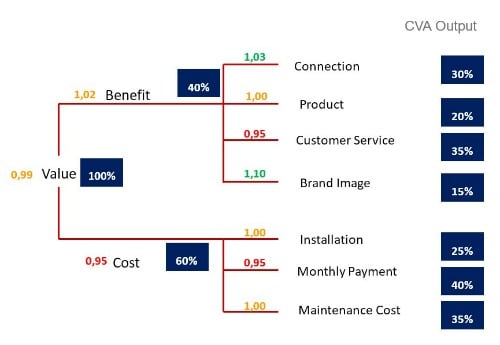
So, in the above example cost is 60% and our company is worse on costs than competition (lower than 1). That means the Customer thinks we are more expensive! (Note, we may not be more expensive, or we may be. But it is the Customer’s perception we are more expensive!)
In the benefits we see that Customer Service is very important at 35% and we are worse than competition. An obvious place to improve ourselves is n Customer Service. And we are good at connection, and therefore we should communicate this to the world.
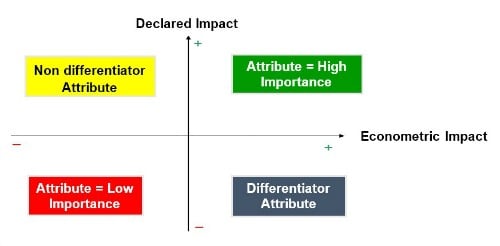
In the next chart, we show that very often a stated response may not be as good as a derived response. But when a stated and a derived response coincide, then that response is very strong and important. See Figure 4.4
Figure 4.4: Impact Weight: Declared vs. Econometric
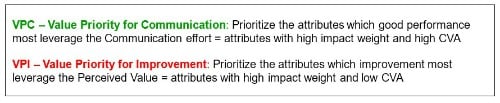
We had also talked about the items to be communicated to the Customer, and areas to work on. Wherever we are better and that item is important to the Customer, it becomes a VPC, a Value Priority for Communication. Where we are worse, and that attribute is important to the Customer, it becomes a VPI or a Value Priority for Improvement (Fig 4.5)
Fig. 4.5 VPC and VPI
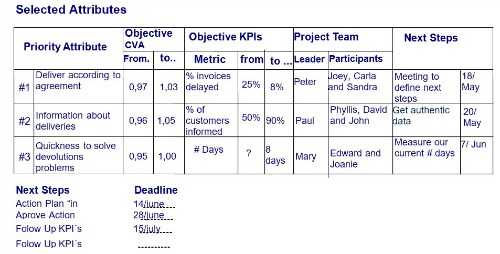
Once we have all this information, we can conduct a workshop on VPI and VPC and put action steps together to move forward See Fig 4.6)
Figure 4.6 Workshop Action Plan Customer Value
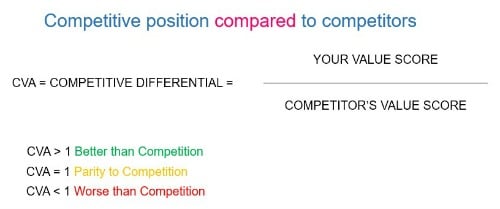
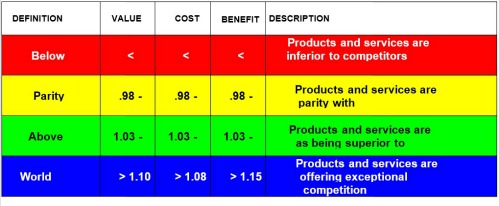
To put into context, what do CVA scores mean in simple terms (see Figure 4.7)
Figure 4.7 Global Definition of CVA Scores
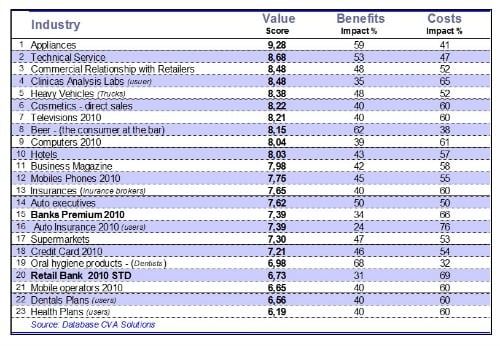
Lastly, just to show that such CVA data exists in many industries, and is very practical. You can see the relative importance of Cost and Benefit for many industries in the chart below Figure 6:
Figure 4.8 shows results of various studies, the scores and the relative importance of price and benefits for various segments and sectors. You will note that the price importance varies from 32% for oral hygiene to 76% for auto insurance. This means the customers have less to differentiate in auto insurance offerings on benefits
Figure 4.8 Value for Industry Econometrics Impacts
Discussion
In this article, you have seen how the Customer Value Added data can be used.
First, we see that the Customer Value Added data is the start to Customer Value Management. The evolution from quality to customer satisfaction to Customer Value is shown. Customer Value Management is shown to be the route to sustainable and profitable growth. CVA and CVM tells you why some Customers buy from you, and why others buy from your competition. The study also shows you why you lose Customers and the tendency to lose Customers. If you know this, you can find ways to reduce churn of Customers.
The output of the CVA study is shown on an attribute tree, and shows what is truly important to the Customer (Customer weighting), and where you must improve, and where (if you are better) you must communicate to the world. The Value you create is only worthwhile if the Customer perceives it. So, if we are good in some attribute we must communicate it.
We then have a Value Priority for Improvement, VPI and a Value Priority for Communication, VPC in our plans.
Next, for improvement, you must set a priority, and for each item you want to improve on, you must have a plan. The plan should tell you how much improvement you want, in what time frame and how, and who is going to do this. Now you have a Customer Value Improvement program in place.
We have also discussed the difference between a stated and an implied Customer response, and when the two coincide, we truly have an important response.
Next we show what the scores mean on a global scale for value, for cost and for benefits. Note that cost and price are not the same. The total cost of a product or service may be far greater than the price you pay. Remember, cost consists of price and non-price terms.
Last, we show some comparative data for various industries on Value and the ratio of benefits and cost.
Do It Yourself
Draw an attribute tree as shown in this chapter for your company’s product or services. Add to the attribute tree, the importance or weightage of various items. See where you are better or worse. Set up a VPI and a VPC for this.
Next, check if your cost/benefit ratio is I line with what has been show in Figure 4.8.
Check whether you are world class or also rans.
Build a Value improvement plan.


