A few years ago, my husband and I took a trip to Greece. We wanted to explore the countryside for a few days and decided to rent a car in Athens. At the reservation desk, the nice gentleman at the counter handed me a road map. Eager to get on our way, I thanked him and put the map in my bag, got into the car and away we went. As my husband was driving, I opened the map to take a look at where we were heading. It’s in English. I took a look out the window. The signs are in Greek. I could not translate the symbols in the Greek words to what I was reading on the map. As they say, “It was all Greek to me” and out the window the map went (not literally out the window). While it was considerate of the car rental representative to hand me a map in my own language, it was a totally useless tool regarding it’s intended purpose. In the end, he truly did not know what I needed.
Know Your Audience
We all know that in every situation, personal or corporate, you need to know your audience. This is not breaking news. However, do you know what information your audience truly needs? What does your Executive Team need to know to make strategic decisions versus what do your agents need to know to perform consistently well? Therein always lays the challenge. Analysis must be relevant to the decisions that the audience must make. Actionable data provides answers, direction and purpose.
Communicating the results of your External Quality Monitoring (EQM) research effort is a key but sometimes overlooked step in the process. Doing this right can be the difference between renewed funding and cutbacks that cannot be supported; the difference between usable feedback and mass confusion; the difference between having an engaged, motivated group dedicated to the Rally Cry for the customer and just getting by with handling customer interactions.
The audiences that are most likely to require feedback from the EQM program:
- Executive management,
- Operational management of each contact center,
- Teams and individual agents.
Each of these audiences will need analysis on different data and graphic or tabular presentations of the data. Additionally, consider when oral presentations will be needed and prepare for those in conjunction with the written reports. Never miss an opportunity to tout the advances made by the program and the benefits achieved.
This 4-Part series focuses on communicating the results that are needed to the appropriate teams and today, we place our focus on Executive Management.
Reports for Executive Management
As a critical function within the enterprise, any report to executive management must summarize the contribution achieved for the investment made. Beyond a mere presentation of high-level numeric results, an executive-level report should include a summary of the mission, the investment in customer relationship management, the contribution to customer loyalty and sales, a summary of the product, services or process issues identified for enhancement and the results of those initiatives (beyond the contact center).
Looking first and foremost at executive management needs, a first-rate presentation is paramount. Looks matter a good deal at this level, so do not skimp on color graphs and high-quality paper.
In general, such a presentation will require an executive summary, a response questionnaire, a narrative, including tables and graphs, as appropriate, and a summary/conclusion section.
1. Executive Summary: Give an overview briefly stating the purpose and results of the research. The executive summary must be parsimonious. It should be brief and cogent, wasting no space or words. Make it as objective and clean as possible.
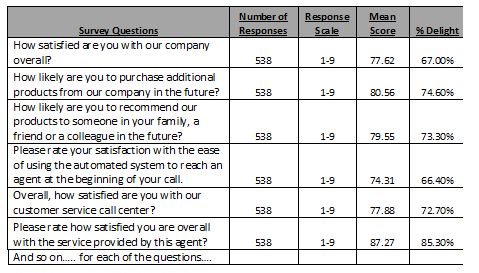
2. Response Questionnaire: Include the survey instruments next. Evaluators of the research need to understand exactly what was asked. It is generally a good idea to include an accounting of the responses to the questions. Those will be readily available from the frequency tables in the analysis printout. You can include both the questionnaire and the responses in this step, hence the name “response questionnaire.” It is also possible to include the means for each question if that information will be meaningful to the reader. Some people are sensitive to the order in which the questions are asked, so it is wise to use that order in this section and indicate this clearly. Avoid needless discussion on question order to save time for the important business of selling executives on the value of the research initiative. Below is an example of a response questionnaire.
3. Narrative: In the narrative, state the purpose at the beginning and the results at the end, but, in between, tell how the research was conducted: who, what, when, where, why, how. Expect to put every piece of important information in the narrative at least twice: once verbally, and at least once more in a table, graph or both. Remember that people do not process information the same way. Some are verbally oriented; others are visual learners, so graphs will be easier to absorb. Still others relate best to numbers — and a table that would put most of us to sleep will sing out loud and clear to them. Include a plan for how the results will be used and outline additional resources needed, including budget, time, space, etc. If the proposed plan can reassign already-available resources without incurring additional expense, then all the better. Put that information in and anything else that supports the argument. Sample components of the narrative section of an executive committee report are shown below.
Example 1
This past quarter, the contact center experienced an unexpected 40 percent increase in call volume, due in large part to the promotional campaign launched in early July. The impact of the large increase in call volume had an adverse effect on operational metrics such as average speed of answer (ASA), average wait time and service level, as well as customer satisfaction levels. As a result, the contact center fell below performance goals on External Quality Monitoring customer satisfaction metrics for the first time over the last five fiscal quarters.
Example 2
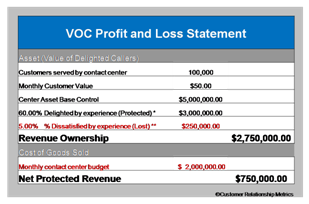
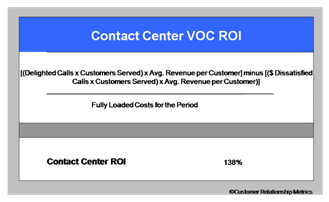
In an average month, 100,000 customers call into our phone support center. At an average monthly value of $50 per customer, our phone support center has the potential to impact approximately $5 million in revenue. This past year, our phone support center reached performance goals (customer delight of 60 percent, and customer dissatisfaction of 5 percent), representing a 15 percent improvement in performance over the prior year. The result of this improvement is the protection of $750,000 of company revenue. In comparing this figure to the operating costs for this same period, a return on investment figure of 138 percent results.
Example 3
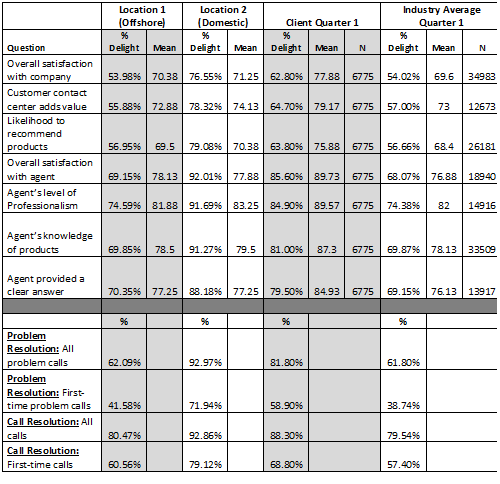
During the first quarter of this year, our contact center once again exceeded the performance of our competitors in the industry. Our domestic location (location 2) contributed to this positive standing, while our offshore location (location 1) continued to struggle to meet performance goals.
4. Summary: The summary/conclusion should again state the purpose of the research, the results of the research, the uses to which the results can be put, and subsequent plans for implementation. This should be much shorter than the narrative, and should highlight what is successful and useful. It is mission critical to aid executives in understanding the research, so make it clear.
The outlined report is intentionally redundant. It is the writer’s job to make it seem less so. Making the same points repeatedly is necessary since this may be the only opportunity to win the case. The idea is to repeat the major points but with more detail from executive summary through narrative, and then summarize again in the conclusion, leaving the reader no choice but to see the absolute reasonableness of the conclusions. A report should not leave the reader with questions. Make all the necessary information available, place that information into multiple formats, polish the language and present it in an appealing report. Again, it is critical to hold this job to the highest standard. Allocate sufficient time for the best report writer and editor available to do this job.
Next in the series, we turn our focus towards the Operations team.
~ Dr. Jodie Monger, President


