
The Holy Grail of 2014 Planning: Marketing Contribution as a % of Total Revenue.
2013 is the last year executives accepted activity-level results from marketing. CEO’s don’t accept activity reports from Sales leaders without revenue results. Expectations of marketing accountability have increased to the level expected of sales performance.
It’s easy to get caught up in reporting activity and miss the big picture. There is so much interesting click data available. Executive marketing leaders need to push the debris aside. Focus on the core business drivers that B2B Marketing is fully capable of providing. Help your team focus by giving them the big picture of the business.
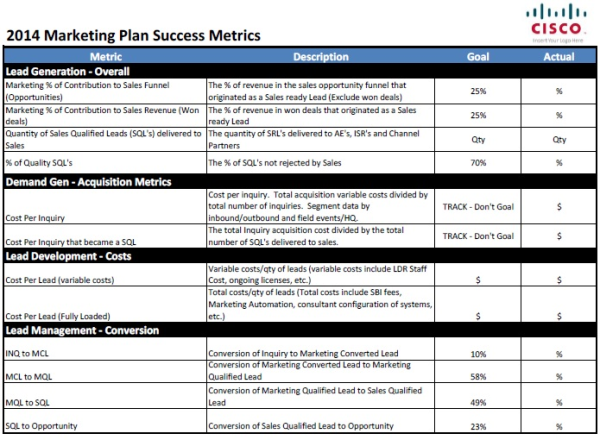
The top three success metrics for B2B marketing include:
- Lead Generation team % of Contribution to Sales Revenue (Wins)
- Lead Generation team % of Contribution to Sales Funnel (Opportunities)
- Quantity of Sales Qualified Leads delivered to Sales (Leads)
By far the most difficult to arrive are the first two metrics. CMO’s are transitioning away from soft success metrics. The metric of choice in 2014 is centered around Marketing Contribution to revenue. Specifically the contribution % of Total Revenue and pipeline Opportunities.
Sounds great doesn’t it? Calculating Marketing Contribution produces a hard metric that is highly relevant to the CEO. However this elusive metric is difficult to quantify. The following two-step framework will help you define contribution.
Find out how your 2014 plan stacks up against world-class plan outcomes. Download our 2014 Marketing Plan Success Metrics to help you maximize planning efforts. Get your copy by signing up for SBI’s 7th annual research tour here: “How to Make Your Number in 2014: A Strategy You Can Execute“.

Step 1. Marketing Contribution Agreement
The senior leadership of marketing and sales must sit down and agree on how to define ‘marketing contribution’ for your business.
Net New Customers are easy to define. It’s common for sales leaders to ask marketing to focus in this area. This makes sense for marketing to direct significant resources on new logos.
Marketing should be engaged in existing customer upsell & cross-sell. This can be difficult to calculate the true marketing contribution. Sales and marketing leadership need to approach this with a partnering mindset.
Sales resources can’t cover every account. Marketing should drive awareness and cultivate early stage interest. By leveraging marketing, sales can increase selling time and funnel opportunities.
Marketing efforts that activate an existing contact to engage should be credited as a contribution by marketing. The percentage of revenue derived from these activations should be tracked and celebrated. This requires defining an ‘Inactivity’ period where a sales rep is not engaged in an active dialogue. As a rule of thumb this is 90-days for a complex sale.
Sales leaders can get sideways when they see ‘activations’ that would have likely happened sooner or later regardless of marketing involvement. Yes, that can be true. The advantage is that marketing efforts drive engagement early in the process. This early engagement is combined with lead nurturing with sales brought in at the right time. Early entry increases close rates and keeps competitors at bay.
Document the agreed definition and maintain a dialogue as marketing and sales review the bottom line results of lead generation.
Run through scenarios to validate that the definition plays out right for common occurrences in the field. Don’t focus on rare exceptions.
Agree on a prototype definition to pilot in the first 90-days. Expect to need to tweak and fine-tune the definition as you begin to track actual results with real-life examples.
Step 2. Determine the % of Marketing Contribution
Begin by separating the revenue into three buckets:
- Net New Customers – New logos
- Existing Customer – Upsell and cross-sell
- Re-occurring Revenue – Maintenance fees, service agreements, license upgrades, etc. that are considered carryover sales from past efforts.
It’s important to split Net New from Existing Customers since they are vastly different in the difficulty of acquisition and the expected percentage of contribution.
Once you have segmented the revenue, think through the expected marketing contribution based on the agreed upon definition.
- Net New Customers – Marketing typically will have a contribution rate of 15-30%. The range varies based on the level of maturity of lead generation capabilities. A world-class marketing team will trend toward 30%.
- Existing Customers – Marketing contribution will range between 10-20%. The % of contribution is lower, but usually greater than Net New revenue.
Leading Indicators of 2014 Planning Success
The third metric is the quantity of Sales Qualified Leads delivered to Sales. This represents a crucial leading indicator that will drive the % contribution metrics.
Making sure you are on track for 2014 requires you to be buttoned up. The conversion rates between stages of the Lead Management Process are tracked to capture trending against B2B averages and historical team performance. Underperformance of the beginning stages can be assessed quickly. Proactive meausres and campaign adjustments be be performed.
The following are examples of leading indicators through the entire revenue lifecycle. You can find a full breakout in the tool download.
In Summary
Shift your team’s focus from activity to results. Leverage the success metrics tool to align your planning efforts to drive tangible business results. The download tool will validate and bridge gaps in planning.
Download our 2014 Planning Success Metrics for Marketing Leaders to help you maximize planning efforts. Get your copy by signing up for SBI’s 7th annual research tour: “How to Make Your Number in 2014: A Strategy You Can Execute“. After signing up, Direct Message me on Twitter @vinkoe or connect with me through LinkedIn to receive your tool quickly.


