
I recently developed a methodology that combines both a structured and unstructured measurement approach.The methodology is based on a single open-ended survey question in which respondents are asked to provide one word that best describes the brand of interest. From this one word, you learn two things about your customers: their sentiment and the reasons behind their sentiment. In today’s post, I will illustrate the use of this methodology by comparing wireless service providers.
Sample
The sample of respondents were solicited from Amazon Turk to complete a customer survey about their current wireless service provider. I received 460 completed survey response. I was able to compare five service providers that had ample sample size (n > 15). The customer survey contained several questions, including a standard customer relationship survey (see Customer Relationship Diagnostic) and an additional question, “What one word best describes your wireless service provider?”
Metrics
Two measures were used to compare the wireless service providers: 1) overall rating of customer satisfaction in which customer provide a rating to indicate their level of satisfaction from 0 (extremely dissatisfied) to 10 (extremely satisfied) and 2) customer sentiment in which customer sentiment is calculated by applying a sentiment score to each word. The sentiment scores for particular words were derived using existing data from several large annotated corpora. This mapping of sentiment values to words constitutes the Customer Sentiment Index. The CSI can range from 0 (negative sentiment) to 10 (positive sentiment).
Results
First, I examined the overall ratings across all five wireless service providers. The average satisfaction rating was 7.3 and the average CSI was 6.9. The correlation between overall satisfaction and CSI was r = .71 (p < .001). This makes sense. Customers who reported higher levels of satisfaction also used more positive words to describe their provider.
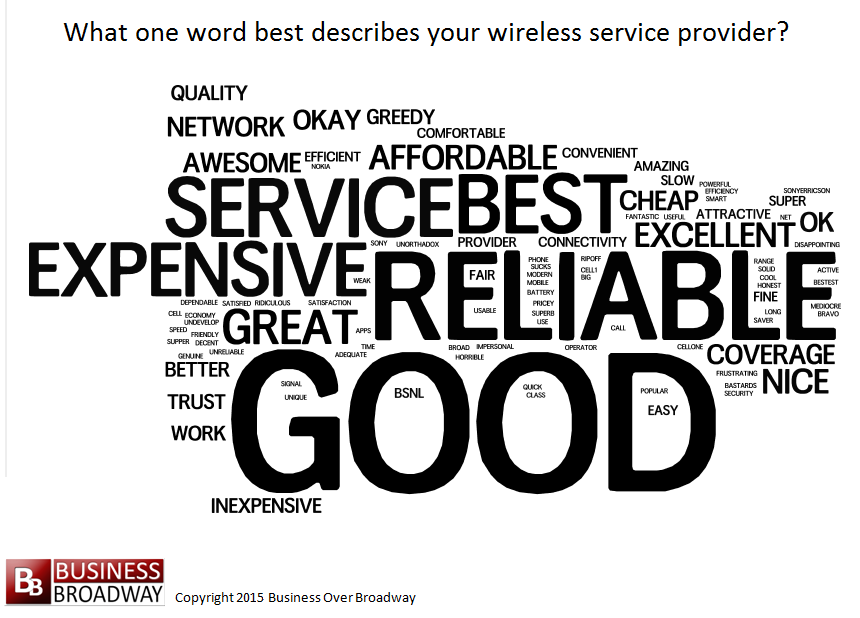
The frequency of words that were used by the all respondents can be seen in the word cloud in Figure 1. Words in large font indicate the word was used by more respondents than words in small font. Overall, the most popular word used to describe service providers was “Good,” “Reliable,” “Service,” “Best,” and Expensive.”
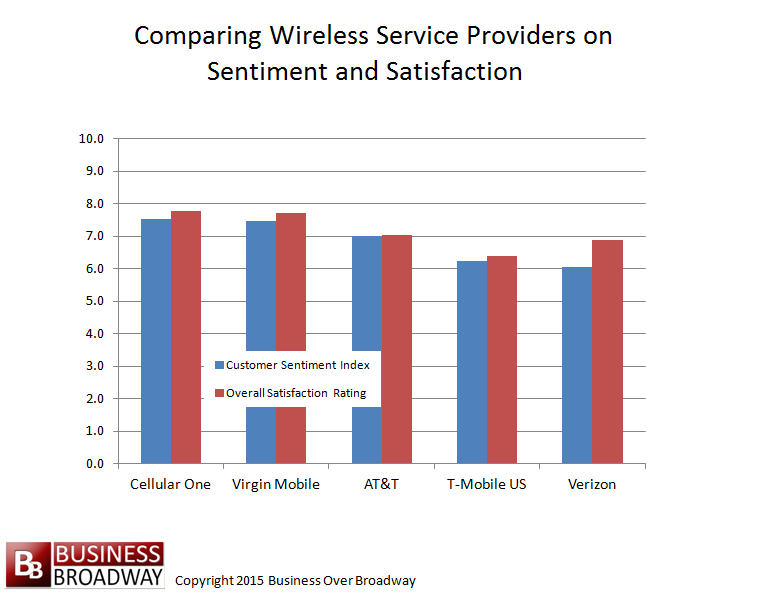
When comparing the five service providers, we see statistically significant differences across the providers (see Figure 2). Cellular One and Virgin Mobile received the highest sentiment scores (i.e., CSI) while T-Mobile and Verizon received the lowest sentiment scores. The results were about the same when the comparison was made using the satisfaction ratings.
Understanding Context
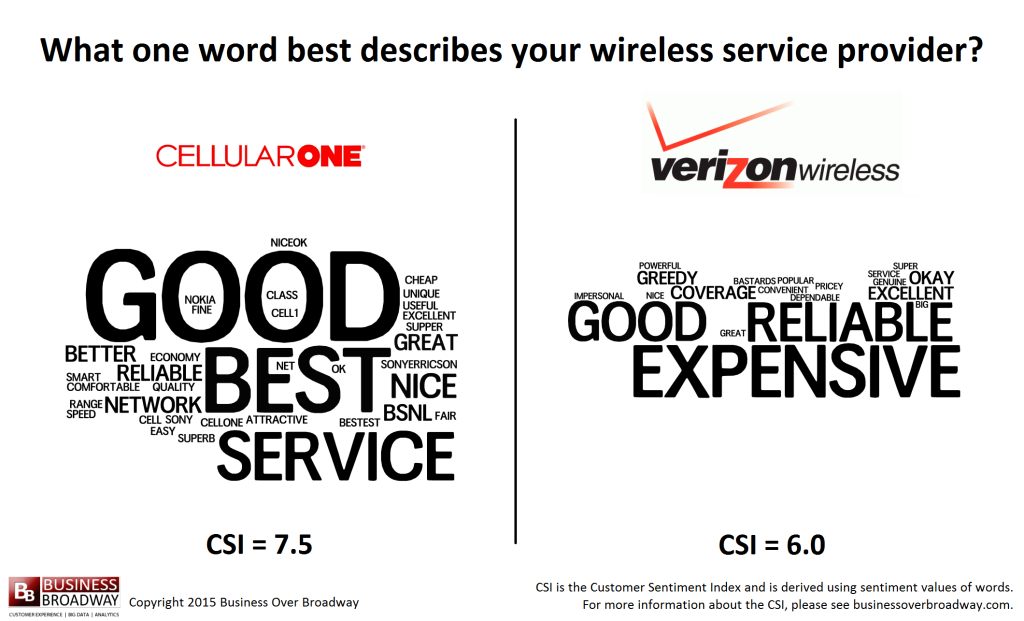
While the “one word” methodology allows us to quantify differences across different entities (in this case, providers) via the CSI, I wanted to examine the actual words that were used by providers to better understand why the differences might occur. To illustrate this difference, I compared two providers, Cellular One and Verizon. I chose these two providers because they represented the two providers with the biggest difference in sentiment (diff = 1.5). Upon examination of the list of words (see Figure 3), we see that Cellular One customers frequently used words like “Good,” “Best,” and “Service.” Verizon Wireless customers, on the other hand, frequently used the word, “Expensive.” Based on this examination, I suspect that service quality is responsible for Cellular One’s higher sentiment marks and that high cost (e.g., “Expensive”) is responsible for Verizon Wireless’ lower sentiment marks.
Summary
I illustrated how a single word response in a customer survey can be used to both quantify customer sentiment toward a brand (via Customer Sentiment Index) and identify the drivers of customer sentiment toward a brand (via word content). The results of this analysis suggest a couple of things: First, the CSI, able to distinguish among a set of providers, has the necessary precision (e.g., reliability) to detect differences across customer segments. Second, the overall satisfaction question that uses a rating scale to measure attitudes may be redundant to the “one word” question that measures customer sentiment. The results using the overall satisfaction rating were comparable to the algorithm-derived score of the CSI. It appears that allowing customers to use their own words to describe a brand gives you more information than requiring them to use a rating scale.


This is a terrific example of how customer experience research is morphing with the times. Artfully bonding unstructured sentiment analysis with a rating structure and creating a prospectively useful and actionable new approach will be valuable for all involved with interpreting the customer’s relationship and transaction perspectives. What you’ve accomplished for wireless can be applied, and at granular level, to scores of b2b and b2c verticals. Well done!
Bob
Spot on, as usual. We tried something similar with a UK retail bank a few years – before the days of text analytics. We researched words customers used and included the 9 most common in a survey: three positive, three negative and three neutral. Respondents were asked to choose up to three that best described their relationship with the bank.
Correlation with satisfaction (whatever measure is used) is of course understandable. What is more interesting is the relationship between the words customers choose and share of wallet.
DJ
Michael,
Thanks for the nice words. Yes, I’ve applied this methodology to both B2B and B2C environments with similar results. I’ve even applied this method in employee surveys (http://businessoverbroadway.com/one-word-can-speak-volumes-about-your-company-culture) and found it to be useful in predicting important organizational outcomes.
Bob
David,
Thanks for the compliment. I happened to include “share of wallet” questions (and likelihood to recommend and switch questions) in the study but just didn’t report them here. Perhaps a follow-up blog post is in order. In summary, what I found was that the Customer Sentiment Index (based on the single word) was also correlated with likelihood to recommend (r = .71), purchase additional services (r = .55), purchase more expensive service plan (r = .44) and switching (r = -.25).
Bob