
The objective of the innovation process is to find ways to help the customer get a job done better and/or more cheaply by addressing desired outcomes that the customer cannot currently achieve—these are their unmet needs. Not all customers struggle in the same ways in getting a job done.
This is why we recommend using our outcome-based segmentation method to discover segments of opportunity. Our data-driven segmentation method reveals segments of customers with different unmet needs. Once these segments are discovered and a specific segmented is selected, we are ready to determine what unmet needs should be targeted to (i) help the customer get the job done better, and (ii) help the customer get the job done more cheaply.
We accomplish this task by employing statistically valid quantitative market research that reveals which outcomes are most underserved (making them targets for getting the job done better), and which are most overserved (making them targets for getting the job done more cheaply).
Our primary tool is a survey that is taken by a representative sample of customers (usually between 180 and 1,200). Their answers reveal the importance of the customers’ 100-plus job-related desired outcomes and how well the customers can achieve each outcome currently. With this data we can determine which outcomes are most under- and overserved. Under- and overserved outcomes represent innovation opportunities.
The opportunity algorithm
To prioritize the opportunities, we employ the “opportunity algorithm.” This algorithm enables us to determine which outcomes are (i) important to customers, and (ii) not satisfactorily achieved with the solution(s) they are currently using to get the job done. The mathematical formula we use is as follows:
Opportunity score = outcome importance + (outcome importance – outcome satisfaction)
This formula calculates the opportunity score for each desired outcome statement, thus revealing those that represent the best opportunities for growth. For example, if 200 out of 270 circular saw users (74%) rate the outcome “minimize the likelihood that the cut goes off track” a 4 or a 5 for importance (on a scale of 1–5, with 5 representing highest importance), and only 75 of the 270 users (28%) rate the satisfaction of the outcome a 4 or a 5 (on a scale of 1–5, with 5 representing greatest satisfaction), then that outcome has an opportunity score of (7.4) + (7.4 – 2.8) = 12.0. In our experience, an opportunity score of 10 or greater indicates that the outcome is underserved.
The opportunity landscape
The opportunity landscape shows visually which outcomes are under- and overserved. As shown in Figure 1, there are three main sections: (1) the underserved section (purple), which includes all outcomes with an opportunity score of 10 or greater, (2) the appropriately served section (white), and (3) the overserved section (gray), in which outcomes’ satisfaction exceeds their importance.
All the outcomes included in the quantitative survey are plotted on this landscape, revealing with a high degree of precision where the targeted segment is under- and overserved.
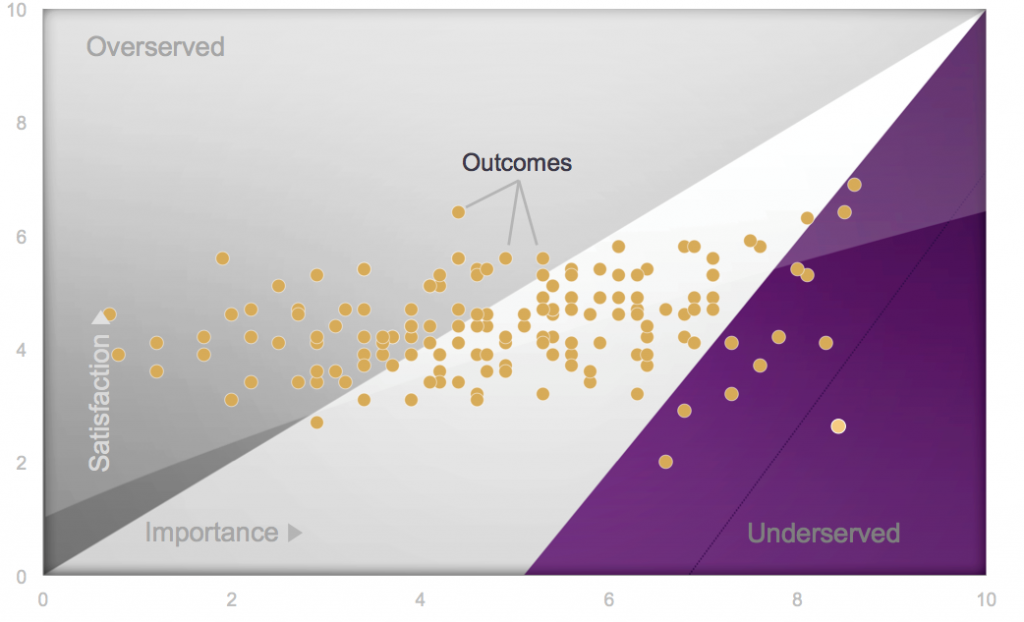
This approach clearly points out which outcomes to target for growth. The outcomes in the lower part of the purple-shaded area are the most underserved. Addressing those outcomes will enable the customer to get the job done better.
Ask yourself what the chances are of developing a product or service that addresses underserved outcomes if the development team doesn’t know what those underserved outcomes—unmet needs—are. You will rightly conclude that the chances are extremely low. But what if the development team knows precisely what those underserved outcomes are? The chances for success go up dramatically. This is the power of the Outcome-Driven Innovation process.
The upper right section of the landscape points out the “table stakes.” These are the important outcomes that a new product must address successfully as customers are currently satisfied by existing solutions. The overserved outcomes in the gray area become targets for cost reduction. If existing products include costly features that address these overserved outcomes, replacing them with lower-cost features can help customers get the job done more cheaply.
The opportunity algorithm and the opportunity landscape are invaluable tools when trying to figure out which outcomes to target for growth.


