 I recently wrote about (and visually illustrated) the different types of customer loyalty in customer experience management programs. In that post, I showed how factor analysis can be used to help us understand the measurement and meaning of customer loyalty. In this week’s post, I use factor analysis to illustrate the measurement of two primary touch points about the customer experience: 1) Product and 2) Customer Service. Similar to the prior post, I adopt a visual approach in presenting factor-analytic results of some prior research. My goal is to convey three things:
- The meaning and measurement of the customer experience
- The redundancy of seemingly disparate survey questions
- The measurement of satisfaction with the customer experience requires fewer questions than you think
Factor Analysis
In its simplest form, factor analysis is a data reduction technique. It is used when you have a large number of variables in your data set and would like to reduce the number of variables to a manageable size. In general, factor analysis examines the statistical relationships (e.g., correlations) among a large set of variables and tries to explain these correlations using a smaller number of variables (factors).
The results of the factor analysis are presented in tabular format called the factor pattern matrix. The factor matrix is an NxM table (N = number of original variables and M = number of underlying factors). The elements of a factor pattern matrix represent the regression coefficients (like a correlation coefficient) between each of the variables and the factors. These elements (or factor loadings) represent the strength of relationship between the variables and each of the underlying factors. The results of the factor analysis tells us two things:
- number of underlying factors that describe the initial set of variables
- which variables are best represented by each factor
Measuring the Customer Experience
Last year, I published an article (Lessons in Loyalty) that employed a sample of about 1000 wireless service provider customers. For this particular sample, customers were asked to rate the quality of different experiences. I used two product questions and five customer service questions, each answered on a 1 (Strongly Disagree) to 5 (Strongly Agree) scale:
- My wireless service provider has good coverage in my area of interest.
- My wireless service provider has reliable service (e.g., few dropped calls).
- Customer service reps respond to my needs in a timely manner.
- Customer service reps have the knowledge to answer my questions.
- Customer service reps are courteous.
- Customer service reps understand my needs.
- Customer service reps are always there when I need them.
- Overall, how satisfied are you with your wireless service provider? (0 – Extremely dissatisfied to 10 – Extremely satisfied)
- If you were selecting a wireless service provider (personal computer) for the first time, how likely is it that you would choose your wireless service provider? (0 – Not at all likely to 10 – Extremely likely)
- How likely are you to recommend your wireless service provider to your friends/colleagues? (0 – Not at all likely to 10 – Extremely likely)
- How likely are you to continue purchasing the same service from your wireless service provider? (0 – Not at all likely to 10 – Extremely likely)
Factor Pattern Matrix
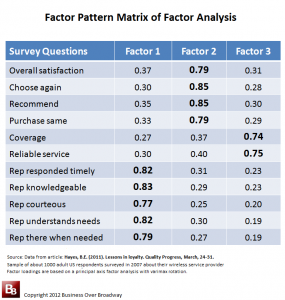
I conducted a factor analyses of the 11 questions. The factor pattern matrix is presented in Table 1. The results of the factor analysis revealed that the 11 questions can be grouped into fewer (in this case, three) factors, suggesting that the questions really only measure three different things.
Labeling of factors is part art, part science and occurs after the number of factors is established. The factor label needs to reflect the content of the questions that are highly related to that factor. The first four loyalty questions have similar patterns of factor loadings and measure something I call Advocacy Loyalty; the next set of loyalty questions that have similar factor loadings measure something else (I call it Coverage / Reliability) and reflects the product aspect of the wireless service providers. And the last set of questions measures something different from all other questions (I call it Customer Service) and reflects the quality of customer service representatives.
Visualizing Customer Experience and Advocacy Loyalty
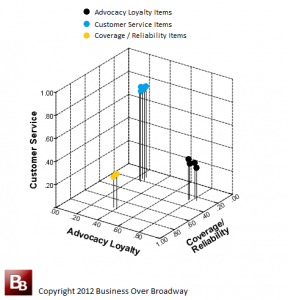
By plotting the factor loadings of each question in graphical form, we see the location of the items in a factor space. This plot is a visual representation of what each question is measuring. You might think of the plot space as the concept of the customer experience and advocacy loyalty, and where each item falls in this factor space tells us what each question is really measuring. This visual approach provides a holistic look at the measurement and meaning of the customer experience and advocacy loyalty.
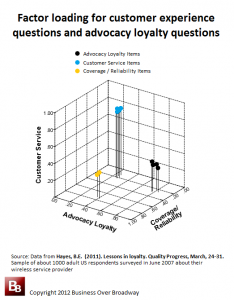
The factor analysis revealed a 3-factor solution, so to plot these loyalty questions, we plot them in a 3-dimensional space. Figure 1 represents the 3-dimensional plot of the factor loadings. Each question is color-coded to reflect the factor on which it has its highest loading (Advocacy questions in black; Customer Service in blue; Coverage / Reliability in orange).
Meaning of Customer Experience and Advocacy Loyalty
Looking at the plot in Figure 1, we can make a few quick judgments about each the customer experience questions and advocacy loyalty questions:
- The 11 customer survey questions measure three components. The factor analysis supports the idea that there is a lot of statistical overlap among these survey questions. So, while we think we are measuring 11 different things in this survey, we are really only measuring 3 different components.
- Advocacy loyalty reflects a general positive attitude toward the company/brand which is different than the customer experience. The four customer loyalty questions, despite appearing to measure different things, are really measuring one underlying construct, advocacy loyalty. Additionally, what is being measured by these advocacy loyalty questions is different than what is being measured by the customer experience questions.
- Coverage / Reliability reflects the customers’ experience with the primary product provided by wireless service providers. Coverage / Reliability questions are clearly distinct from the other questions in the survey. Based on the results, it is mathematically acceptable to calculate an overall score for “Product Quality” of wireless service providers by averaging the responses of the two questions that load highly on this factor (e.g., Coverage and Reliable service).
- Customer Service reflects the customers’ experience with the customer service representatives. Customer Service questions are clearly distinct from the other questions in the survey. Based on these results, it is mathematically acceptable to calculate an overall score for “Customer Service Quality” by averaging the responses of the five questions that load highly on this factor (e.g., Courteous, Knowledgeable, Understands needs).
The Value of Measuring the Customer Experience Via Surveys: Specific and General CX Questions
Customer relationship surveys, the foundation of many customer experience management (CEM) programs, are used to measure the quality of the customer experience and different types of customer loyalty. Customer experience (CX) questions can be general or specific in nature. General CX questions reflect general touchpoints (e.g., product quality meets my needs, service quality was excellent). Specific CX questions (the ones used in this survey) reflect specific aspects of the general touch points (e.g., coverage, knowledgeable, courteous). The factor analysis of the customer experience (CX) questions showed that the different specific CX questions might be overly redundant; there is not a lot of statistical differences among specific CX questions that measure the same general touch points.
In a prior post, I talk about the value of general and specific CX questions and show that general questions explain most of the differences in advocacy loyalty while specific CX questions don’t explain anything additional beyond general CX questions. The results of the current factor analysis of specific CX questions support the same conclusion. So, using only one general Customer Service CX question (e.g., Overall satisfaction with customer service) might be just as effective as using the five specific Customer Service CX questions.
An Optimal Customer Relationship Survey
Customer relationship surveys are used to identify the reasons behind dis/loyalty of your customers. Be mindful of this fact when you are developing a customer survey. Using specific CX questions seems overly redundant for customer relationship surveys. As we saw above, customers are simply unable to distinguish among specific CX questions within a given general touch point. Consider using general CX questions with an open-ended comments question to get at the reasons why customers gave a rating on a general CX question.
I am a big fan of short customer surveys; I bet your customers feel the same way. I contend that an optimal customer relationship survey needs fewer questions than you think. Here is my summary for an optimal customer survey.


