
Customer relationship surveys play a major role in helping improve the customer experience and increase customer loyalty. By gathering customer perceptions of their experience as well as their likelihood of engaging in different types of customer loyalty behaviors, companies are able to use these data to get insight about how to improve the quality of the customer relationship to improve customer loyalty. In their attempts to improve systemic problems, companies use these data to identify where customer experience improvement efforts will have the greatest return on investment (ROI). In this post, I will illustrate how to use customer feedback data from your relationship survey to identify where you need to invest to make improvements to increase customer loyalty that optimizes the return on those investments.
This method, referred to as Loyalty Driver Analysis, is a business intelligence solution that distills the customer feedback data into meaningful information. Loyalty Driver Analysis provides the necessary insights you need to direct your customer experience improvement efforts to business areas (e.g., product, service, account management, marketing) that matter most to your customers.
The Experience and Loyalty
Customer relationship surveys allow customers to provide feedback in two important areas: 1) their satisfaction with different customer touch points (e.g., product quality, customer service, account management/sales) and 2) their loyalty (e.g., recommend, buy again, stay).
Analyzing the Data: Descriptive and Predictive Analytics
Two general analytics approaches are used in Loyalty Driver Analysis: 1) Descriptive and 2) Predictive. Descriptive analytics are used to indicate the current state of the world. In our case, descriptive analytics helps us know the current satisfaction level of each customer touch point and the current state of customer loyalty. The level of satisfaction is index by a summary statistic. While different summary statistics can be used, I use the mean score (sum of all responses divided by the number of respondents).
Predictive analytics are used to make predictions about future events. In our case, predictive analytics helps us know how strongly/weakly each of the customer touch points is related to customer loyalty. The relationship between CX touch points and customer loyalty can be calculated by simply correlating the ratings of the touch point with the customer loyalty ratings. This correlation is referred to as the “derived importance” of a particular touch point. If the survey has measures of seven (7) touch points, we will calculate seven (7) correlations. Higher correlations (max is 1.0) indicate a strong relationship between the touch point and customer loyalty (e.g., business area is important to customers). Low correlations (near 0.o) indicate a weak relationship between the touch point and customer loyalty (e.g., business area is not important to customers).
The Loyalty Driver Matrix: Prescriptive Analytics
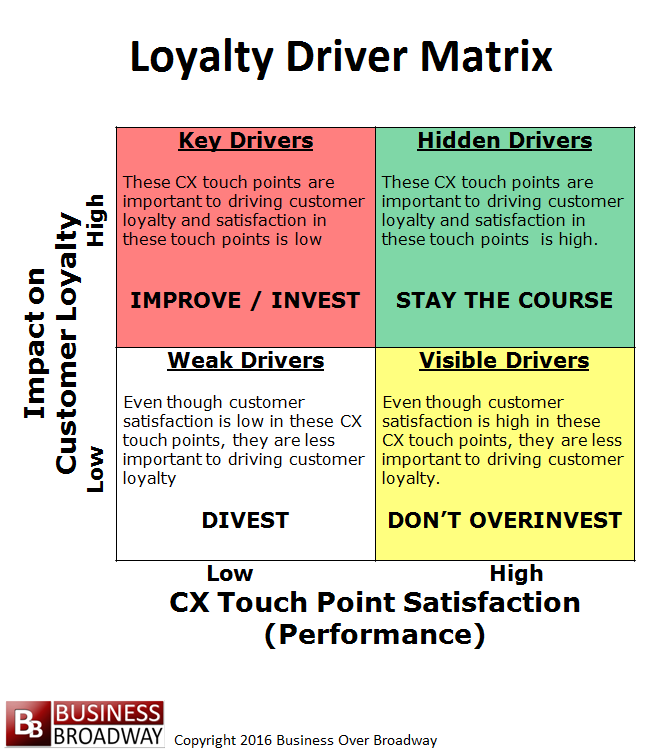
Figure 1. Loyalty Driver Matrix. Prescriptive Analytics in Practice
So, we now have the two pieces of information for each CX touch point: 1) Customer satisfaction (Performance: how well we are serving our customers) and 2) Impact on customer loyalty. We combine these two types of analytics (i.e., descriptive and predictive) to help us know what we need to do to increase customer loyalty. Known as prescriptive analytics, this analytics approach suggests decision options “to take advantage of a future opportunity or mitigate a future risk and show the implication of each decision option.” We combine the results of the descriptive analytics and predictive analytics by plotting the two pieces of information for each CX touch point.
The abscissa (x-axis) of the Loyalty Driver Matrix is the performance index (e.g., mean score, top box percentage) of the business areas. The ordinate (y-axis) of the Loyalty Driver Matrix is the impact (correlation) of the business area on customer loyalty.
The resulting matrix is referred to as a Loyalty Driver Matrix (see Figure 1). By plotting all seven datapoints, we can visually examine all business areas at one time, relative to each other.
Understanding the Loyalty Driver Matrix: Making Your Business Decisions
The Loyalty Driver Matrix is divided into quadrants. Each of the CX touch points that were included in the survey will fall into one of the four quadrants. The business decisions you make about improving the customer experience will depend on the quadrant in which each CX touch point falls:
- Key Drivers: CX touch points that appear in the upper left quadrant are referred to as Key Drivers. Key drivers reflect attributes that have both a high impact on customer loyalty and have low satisfaction (performance) ratings relative to the other CX touch points. These attributes reflect good areas for potential CX improvement efforts because we have ample room for improvement and we know attributes are linked to customer loyalty; when these attributes are improved, you will likely see improvements in customer loyalty (e.g., recommending, increase buying, staying).
- Hidden Drivers: CX touch points that appear in the upper right quadrant are referred to as Hidden Drivers. Hidden drivers reflect attributes that have a high impact on customer loyalty and have high satisfaction ratings relative to other CX touch points. These attributes reflect your company’s strengths that keep the customer base loyal. For CX attributes that fall into this quadrant, we recommend the company stay the course. Consider using these CX touch points in marketing and sales collateral in order to attract new customers, increase purchasing behaviors or retain customers.
- Visible Drivers: CX touch points that appear in the lower right quadrant are referred to as Visible Drivers. Visible drivers reflect touch points that have a low impact on loyalty and have high performance ratings relative to other CX touch points. These touch points reflect the company’s strengths. These areas may not impact loyalty but they are areas in which you are performing well. Consider using these business areas in marketing and sales collateral in order to attract new customers. Because these areas do not highly impact customer loyalty, don’t over-invest in these areas.
- Weak Drivers: CX touch points that appear in the lower left quadrant are referred to as Weak Drivers. Weak drivers reflect touch points that have a low impact on loyalty and have low performance ratings relative to other touch points. These touch points are lowest priorities for investment. You might consider divesting improvement efforts in these areas. Despite the fact that customer satisfaction is low in these touch points, they do not have a substantial impact on whether or not customers are loyal to the company.
Example

Figure 2. Loyalty Driver Matrix for Software Company
A software company wanted to understand the health of their customer relationship. Using a customer relationship survey, they collected feedback from nearly 400 of their customers. Applying driver analysis to this set of data resulted in the Loyalty Driver Matrix in Figure 2. The results of this driver analysis shows that Account Management is a key driver of customer loyalty; this touch point is the top candidate for potential customer experience improvement efforts; it has a large impact on advocacy loyalty AND there is room for improvement.
While the Loyalty Driver Matrix helps steer you in the right direction with respect to making improvements, you must consider the cost of making improvements. Senior management needs to balance the insights from the feedback results with the cost (labor hours, financial resources) of making improvements happen. Maximizing ROI occurs when you are able to minimize the costs while maximizing customer loyalty. Senior executives of this software company implemented product training for their Account teams. This solution was inexpensive relative to the expected gains they would see in new customer customer growth (driven by advocacy loyalty). Additionally, the company touted the ease of doing business with them as well as the quality of their products, customer service and technical support in their marketing and sales collateral to attract new customers.
Summary
Loyalty Driver Analysis is a business intelligence solution that helps companies understand and improve the health of the customer relationship. The Loyalty Driver Matrix is based on two key pieces of information: 1) Performance of the business area and 2) Impact of that business area on customer loyalty. By integrating the results of your descriptive and predictive analytics efforts, you are able to identify Using these two key pieces of information about each CX touch point, senior executives are able to make better business decisions to improve customer loyalty and accelerate business growth.
An earlier version of this article originally appeared on Clicktools.


